| Active members and centres 2025 year-end snapshot |
||||
| Status and type | Centres | Members | % of total | |
|---|---|---|---|---|
| Shambhala Meditation Centre | 65 | 4,205 | 69% | |
| Shambhala Meditation Group | 49 | 631 | 10% | |
| Shambhala Online and Global | 2 | 916 | 15% | |
| Practice Centre | 10 | 302 | 5% | |
| Other | 8 | 1 | 0% | |
| Retreat Place | 1 | 0 | 0% | |
| Total | — | 135 | 6,055 | 100.0% |
Counting centres and their members
1 Types of Shambhala Groups and Centres
Using administrative data, there are several ways of assessing how many centres or groups are active in Shambhala. Each may tell a different story or a different facet of the whole story. For example, we can look at activity levels in different ways, such as:
- by whether a centre or group is marked as “active” in the SDB (an administrative designation based on leadership communication with SGS),
- by whether a group or centre has people affiliated with it (See Section 2 for a year-to-year comparison),
- by whether the group or centre offers programs requiring registration, and
- by whether people affiliated with a centre or group register for programs offered at any location (e.,g., including online or at other centres). (See Section 4 for a year-to-year comparison of these two measures of activity level.)
At the end of 2025, 65 Shambhala Centres and 49 Groups were recorded as active. Currently 18 members are affiliated with centers that are marked as dissolved in the SDB.
| Active members and centres 2024 year-end snapshot |
||||
| Status and type | Centres | Members | % of total | |
|---|---|---|---|---|
| Shambhala Meditation Centre | 68 | 4,531 | 78% | |
| Shambhala Meditation Group | 52 | 781 | 13% | |
| Shambhala Online and Global | 2 | 166 | 3% | |
| Practice Centre | 10 | 343 | 6% | |
| Other | 10 | 1 | 0% | |
| Retreat Place | 1 | 0 | 0% | |
| Total | — | 143 | 5,822 | 100.0% |
Between 2024 and 2025, 750 members who were affiliated with dissolving centers were marked as members of Shambhala Global, leading to a jump from around 166 members in 2024 to 916 in 2025.
| Active members and centres 2023 year-end snapshot |
||||
| Status and type | Centres | Members | % of total | |
|---|---|---|---|---|
| Shambhala Meditation Centre | 68 | 4,689 | 79% | |
| Shambhala Meditation Group | 52 | 721 | 12% | |
| Shambhala Online and Global | 2 | 161 | 3% | |
| Practice Centre | 10 | 340 | 6% | |
| Other | 10 | 1 | 0% | |
| Retreat Place | 1 | 0 | 0% | |
| Total | — | 143 | 5,912 | 100.0% |
This table provides a context for the qualitative findings in the survey.
The 916 members who are affiliated with Shambhala Global Services (SGS) in 2025 includes the 166 people who were previously affiliated with SGS plus 750 who were previously affiliated with groups or centres that have now dissolved. The survey data indicates that members who do not relate to a center tend to rate their sense of belonging and willingness to recommend Shambhala as low. The Societal Mirror has not included direct questions about how how people could reconnect to a Shambhala community, whether personally or by digital means
2 Counting groups and centres by size of membership
Land centers and an online-only group are excluded from this analysis, as they do not fit into the size categories.
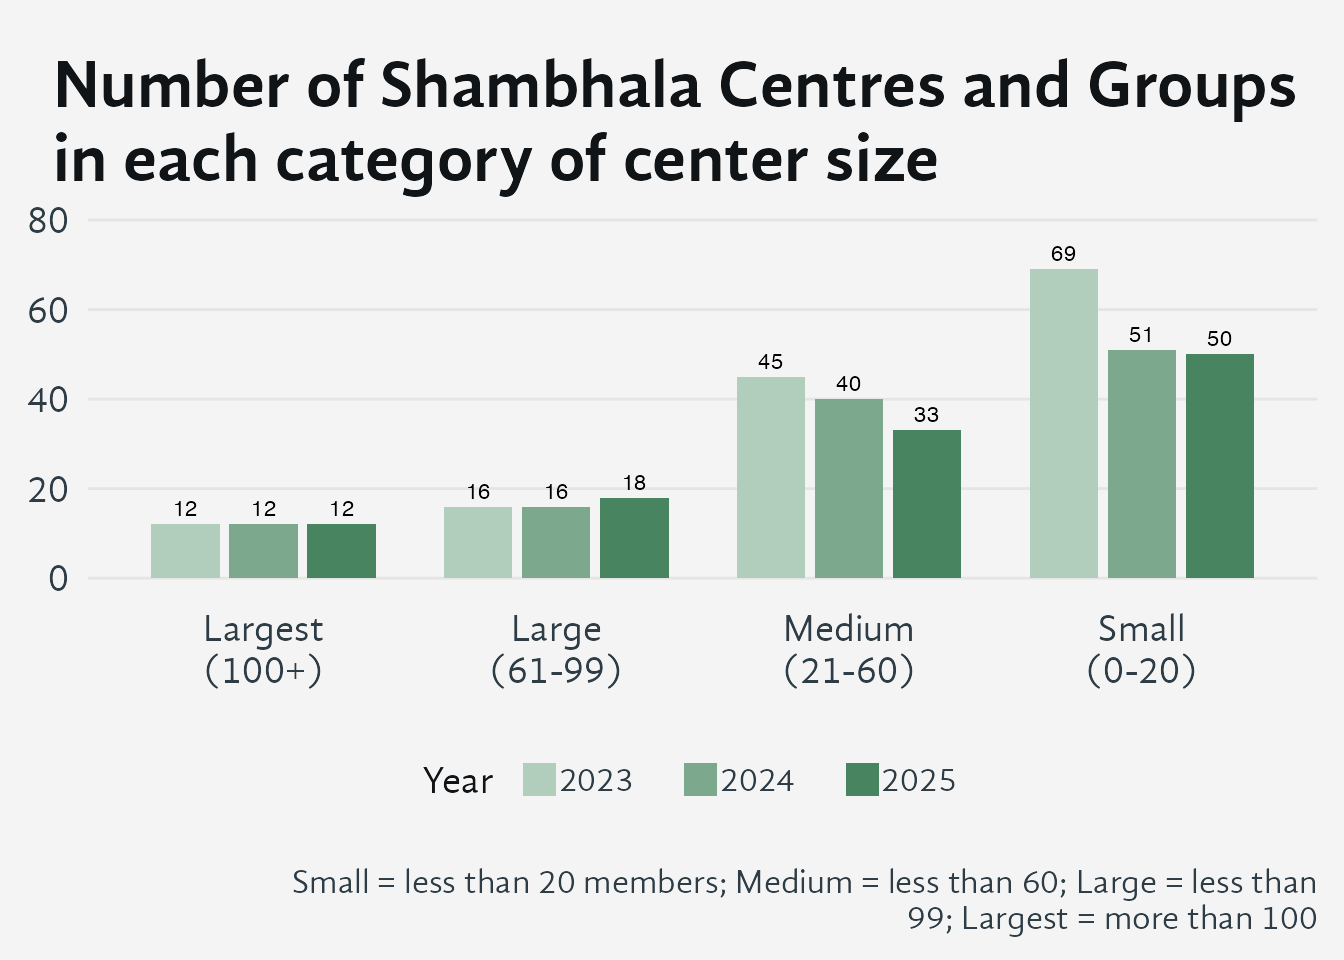
Medium-sized centres have declined each year over the three-year period shown, while small centres held steady in the last two years. The Large and largest centres have been more stable across the period. Some changes may simply be due to centres changing size due to membership gains or losses.
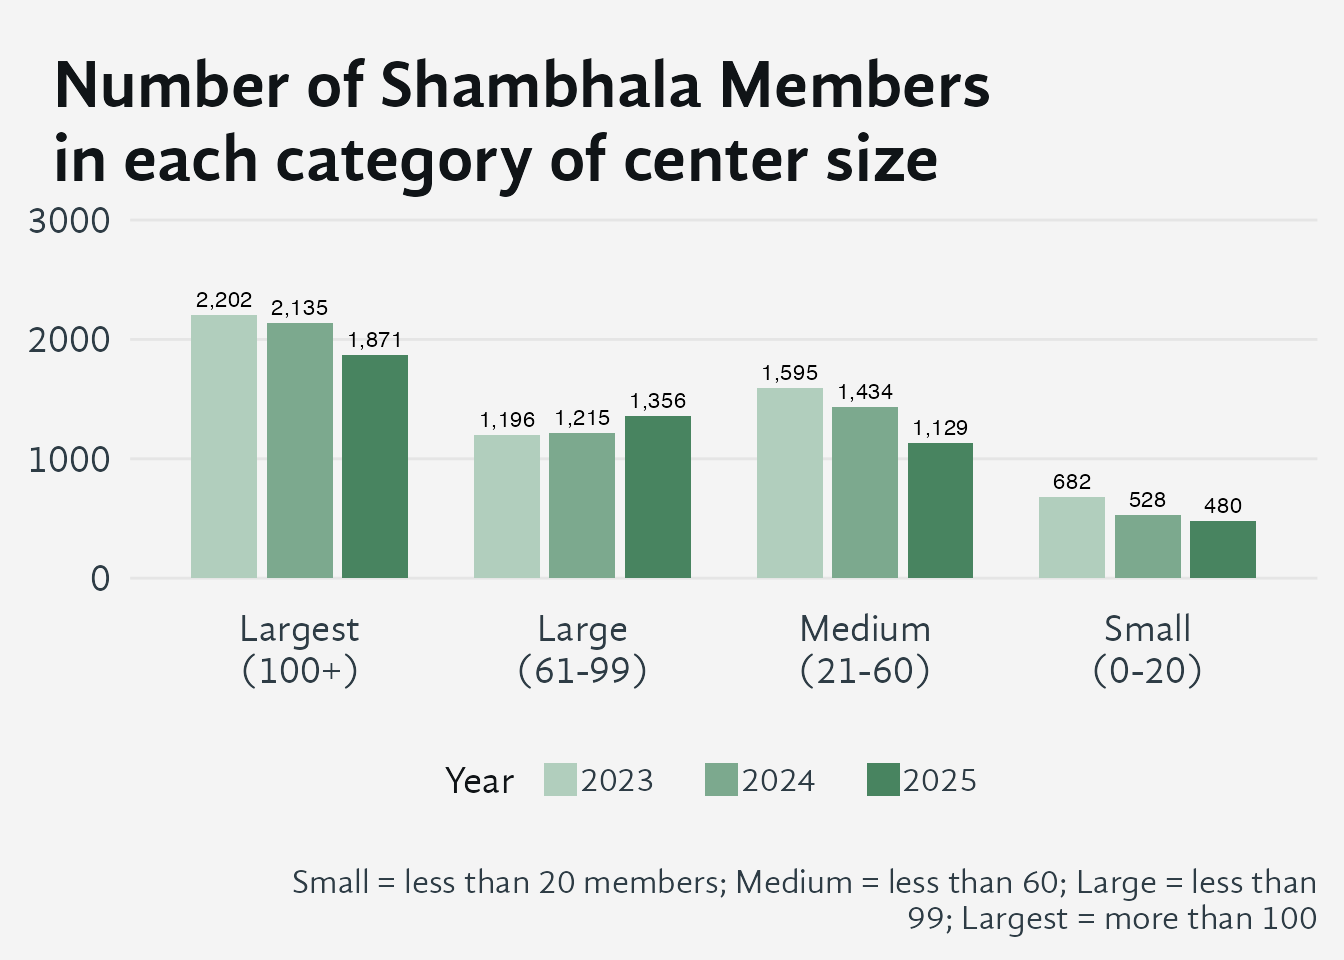
Small and medium centres lost roughly 29% of their members over the period, closely tracking the decline in the number of centres in those categories. Large centres grew slightly in both count and membership, while the largest centres shed about 15% of their members even as their count remained unchanged, suggesting a retention problem at the upper end of the size spectrum.
As can be seen by comparing Figures 1 and 2, while the number of smaller centres greatly outweighs the number of larger centres, the very great majority of members are affiliated with the larger centres.
3 Global Community Council Regions
The Global Community Council (GCC) regions is a community governance body representing Shambhala center and group members. Representation is clustered in ‘constellations’ reflecting region and/or language. See the map on the Membership page. Membership declines are spread across all the GCC regions.
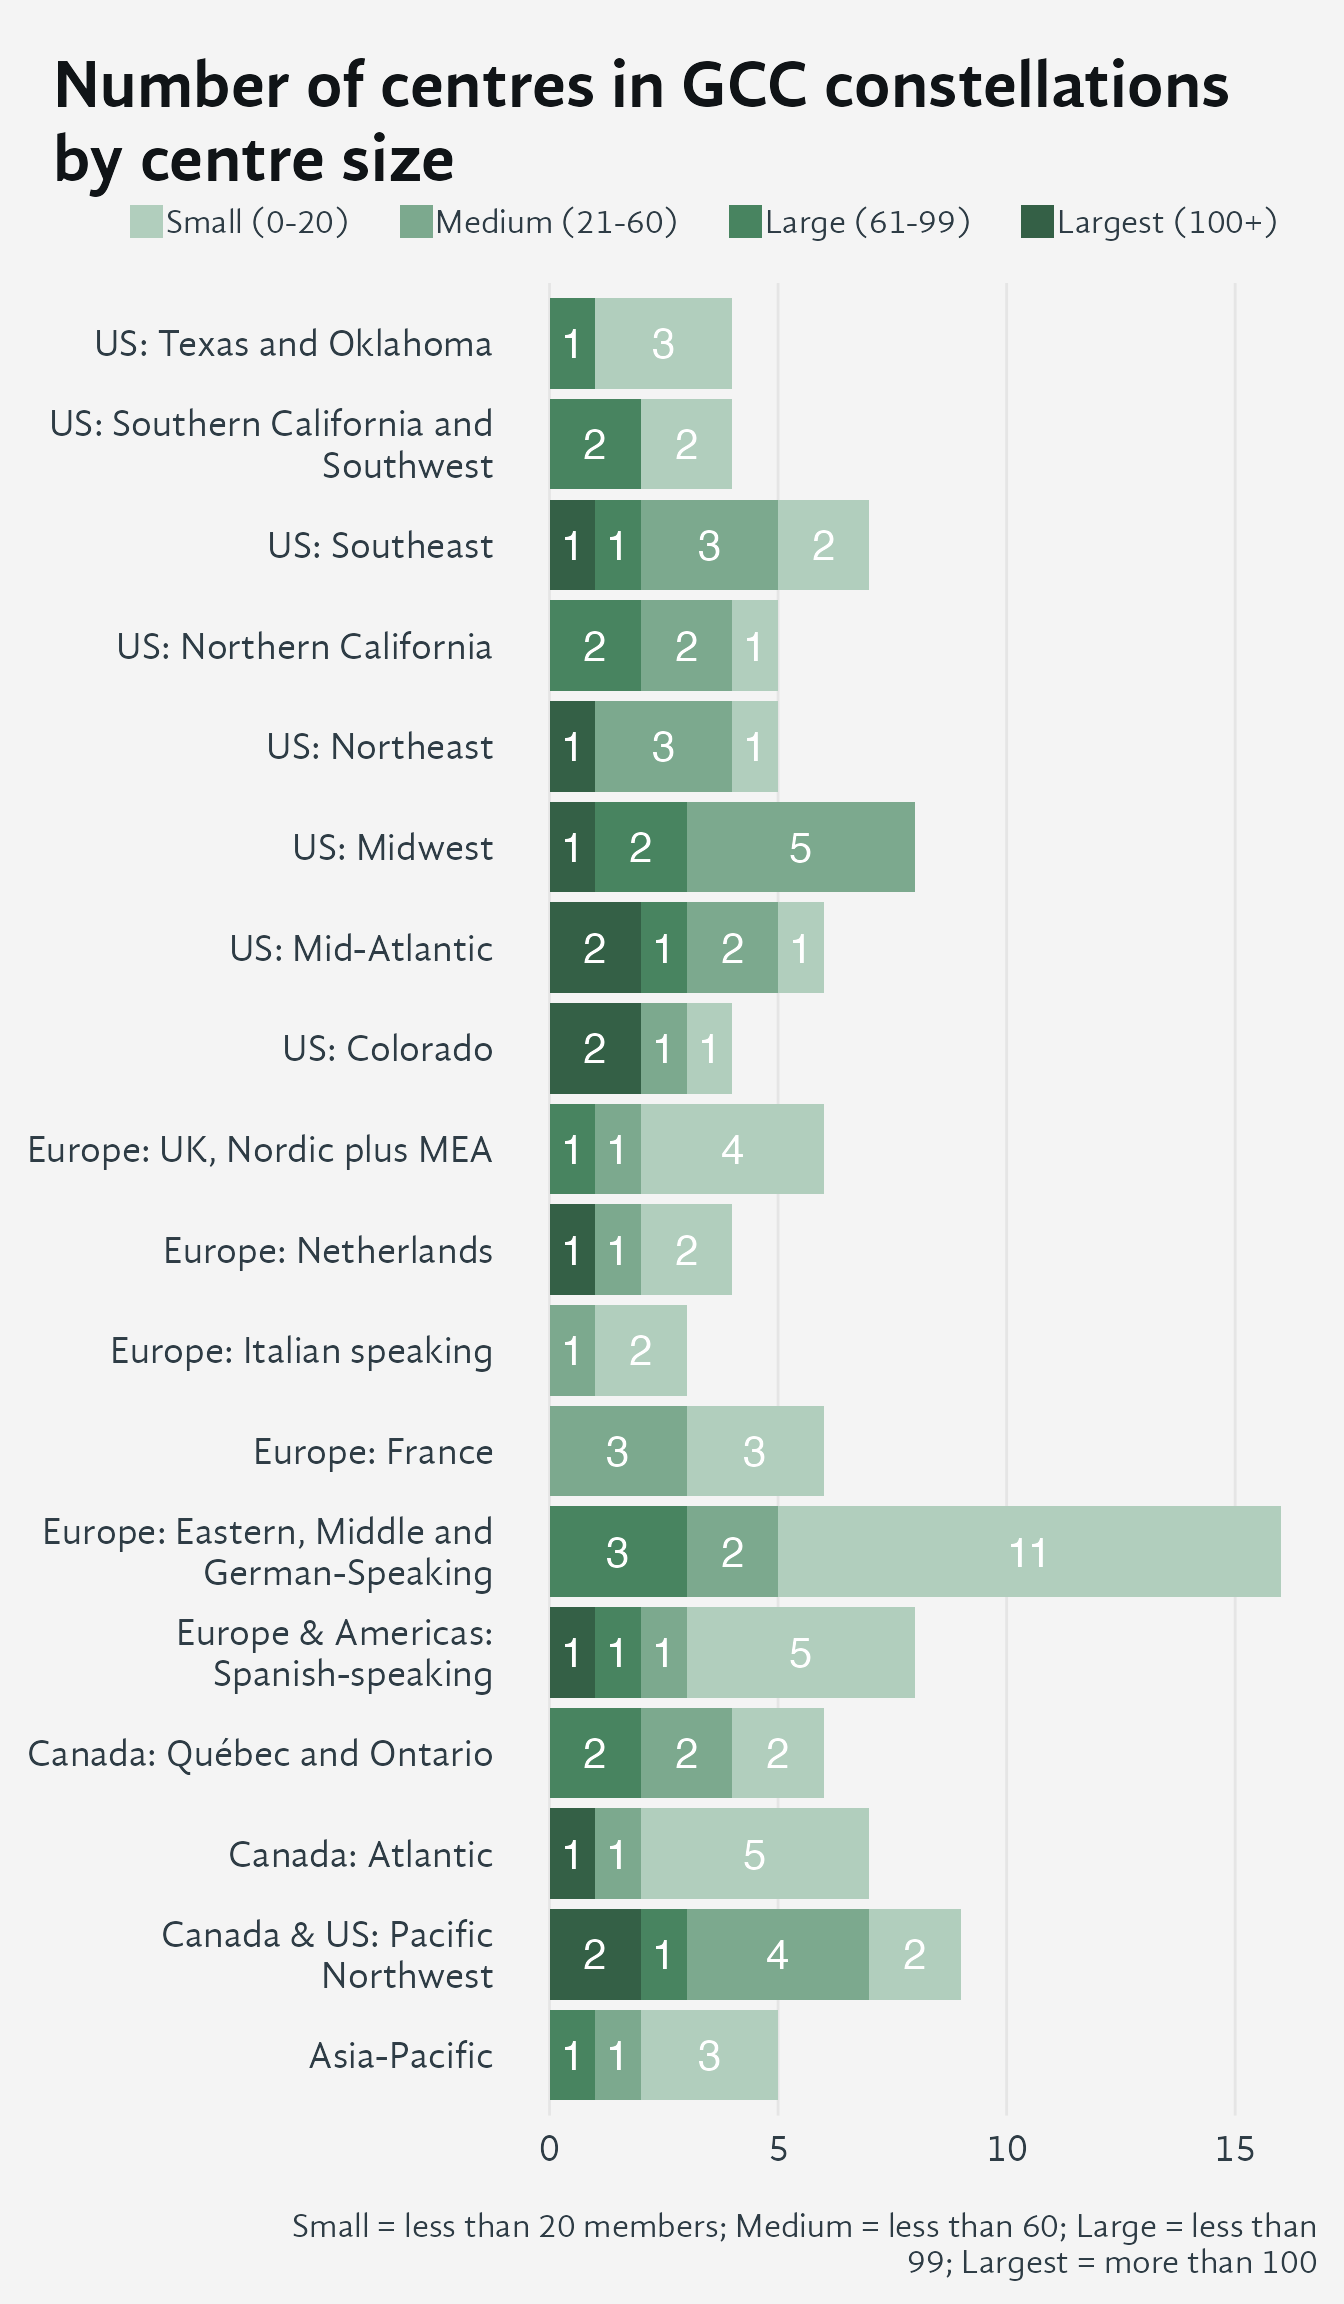
The size composition of centres varies considerably across GCC constellations. When combined with the overall member count trends, the picture shows that no constellation is immune to membership pressure — all are managing losses of members or centres, or both.
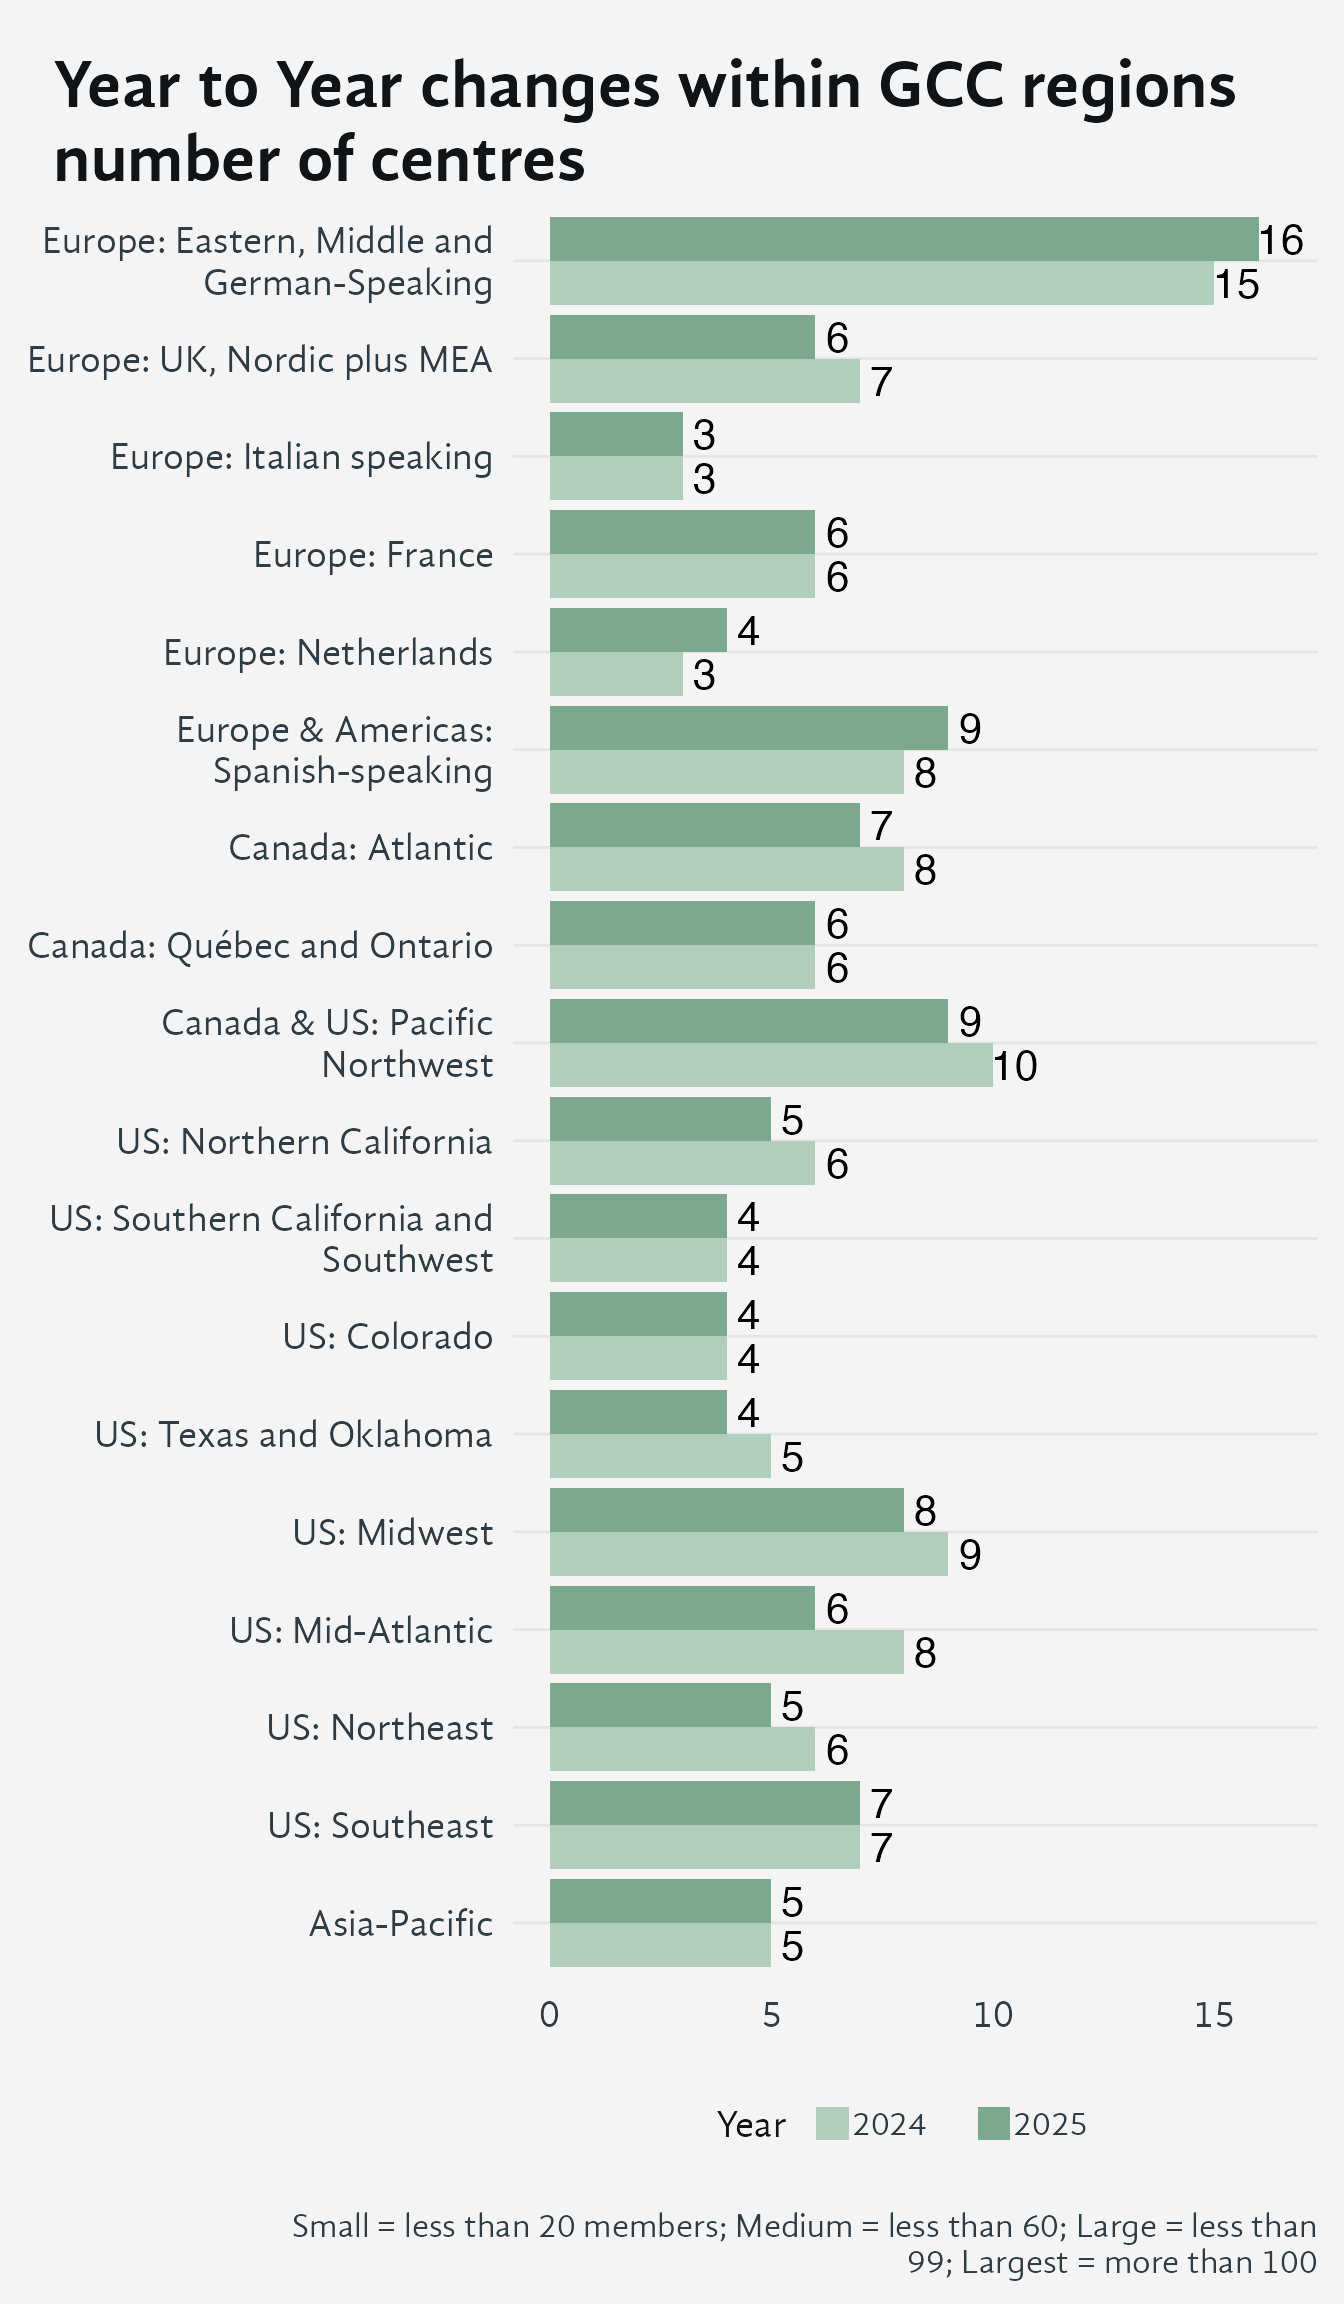
This shows that only 3 of the constellations have added new centers, 8 have lost centers and 6 have remained the same.
4 Activity level as an indicator
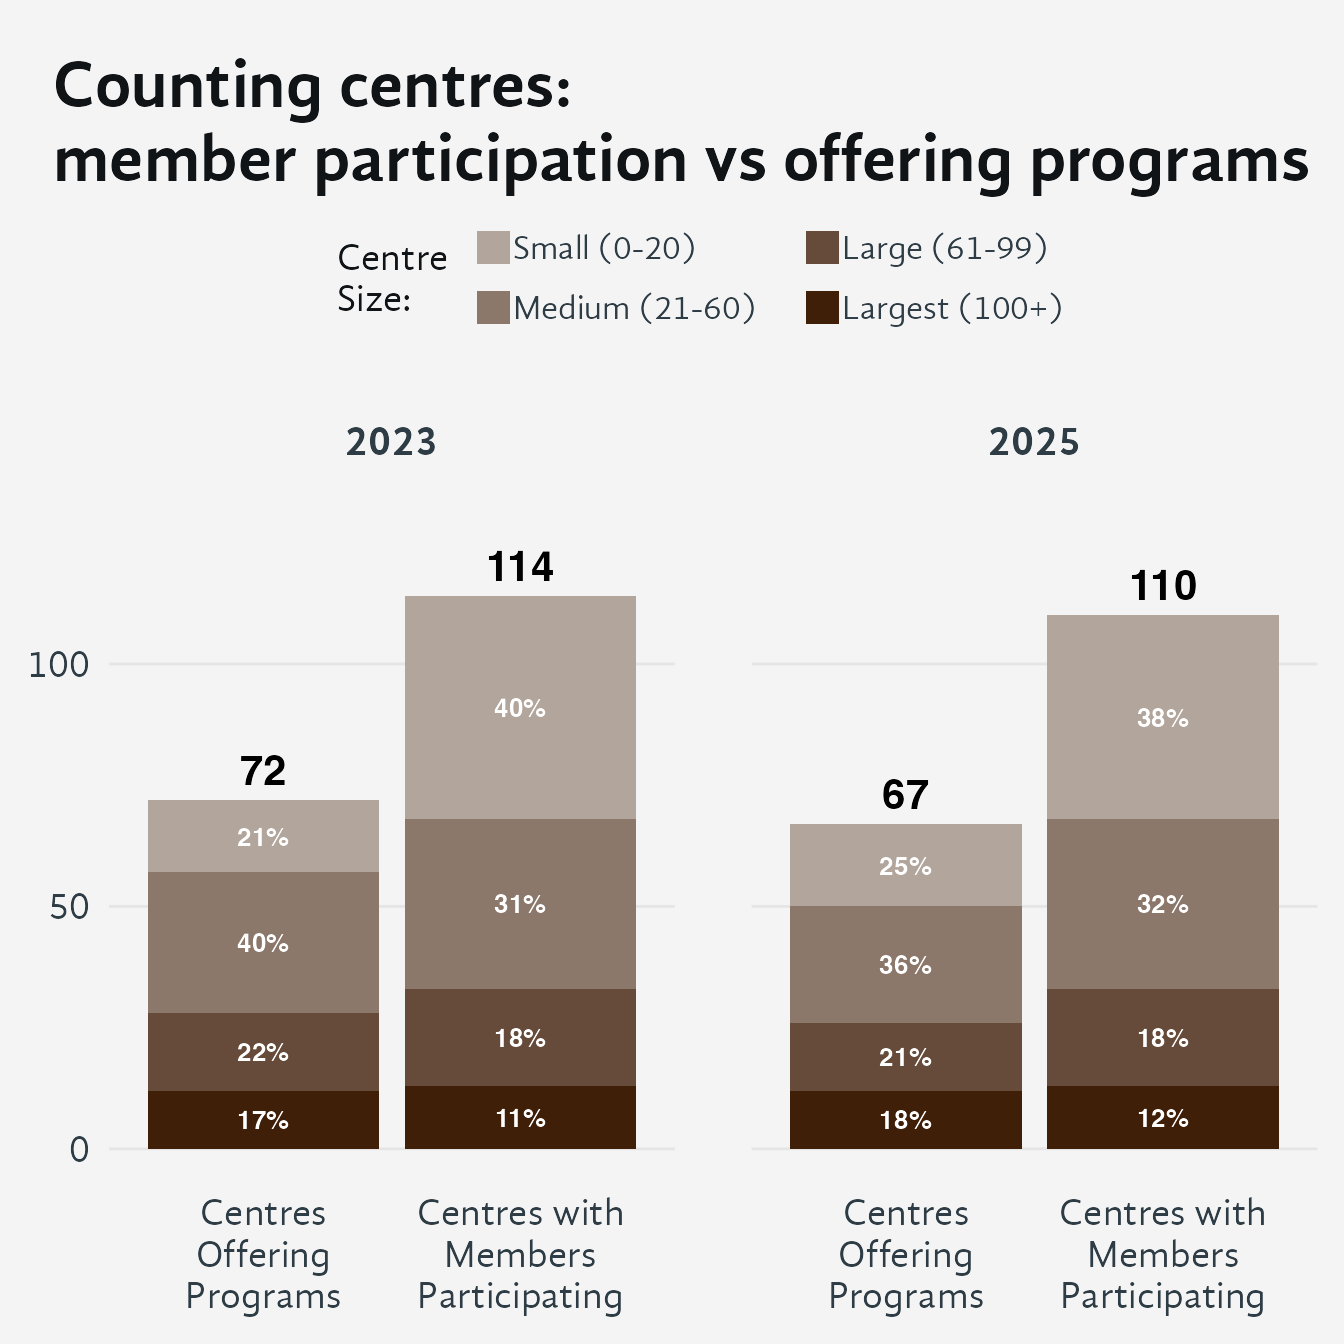
| Size of Centre / Group |
2023
|
2025
|
|||
|---|---|---|---|---|---|
| Centres Offering Programs | With Members who Participate | Centres Offering Programs | With Members who Participate | ||
| Small (0-20) | 15 | 46 | 17 | 42 | |
| Medium (21-60) | 29 | 35 | 24 | 35 | |
| Large (61-99) | 16 | 20 | 14 | 20 | |
| Largest (100+) | 12 | 13 | 12 | 13 | |
| Total | — | 72 | 114 | 67 | 110 |
Comparing 2023 and 2025, the total number of centers are roughly comparable. The big difference to note is between the number of centres that offer programs and the number of centres whose members participate anywhere. In both years, the small centres account for a disproportionate share of external participation, likely because they have less capacity to host programs of their own. What the data suggest is that individual members of centres are attending programs at other centres as well as their own.