Centre Relationships

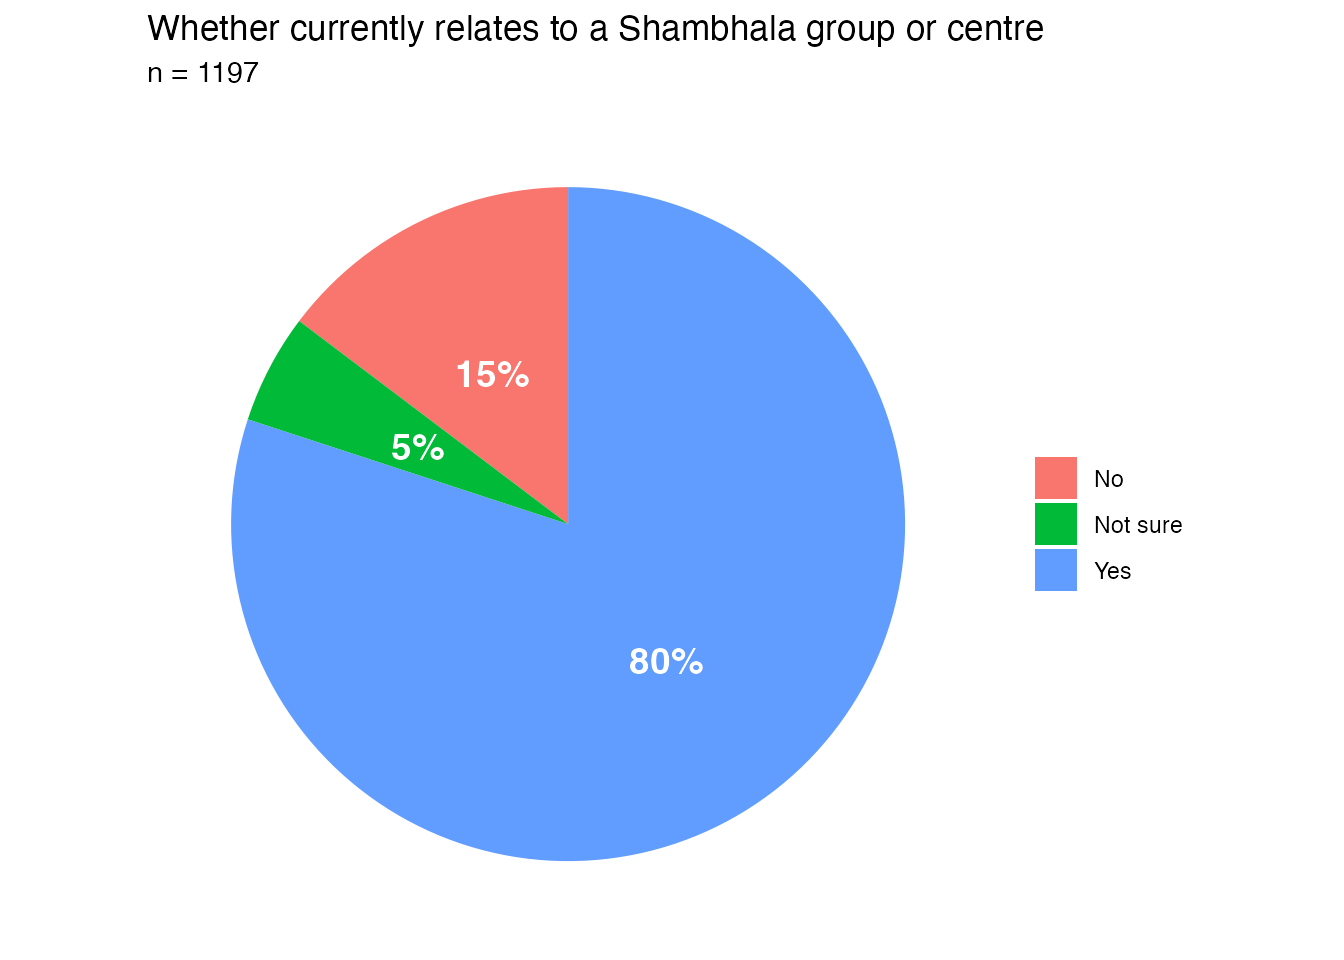
1 Whether currently relates to a Shambhala group/centre
About 80% of survey respondents currently relate to a Shambhala group or centre. The remaining 20% are divided between those who do not and those who are unsure of their connection.
2 Relating to a local centre by centre size
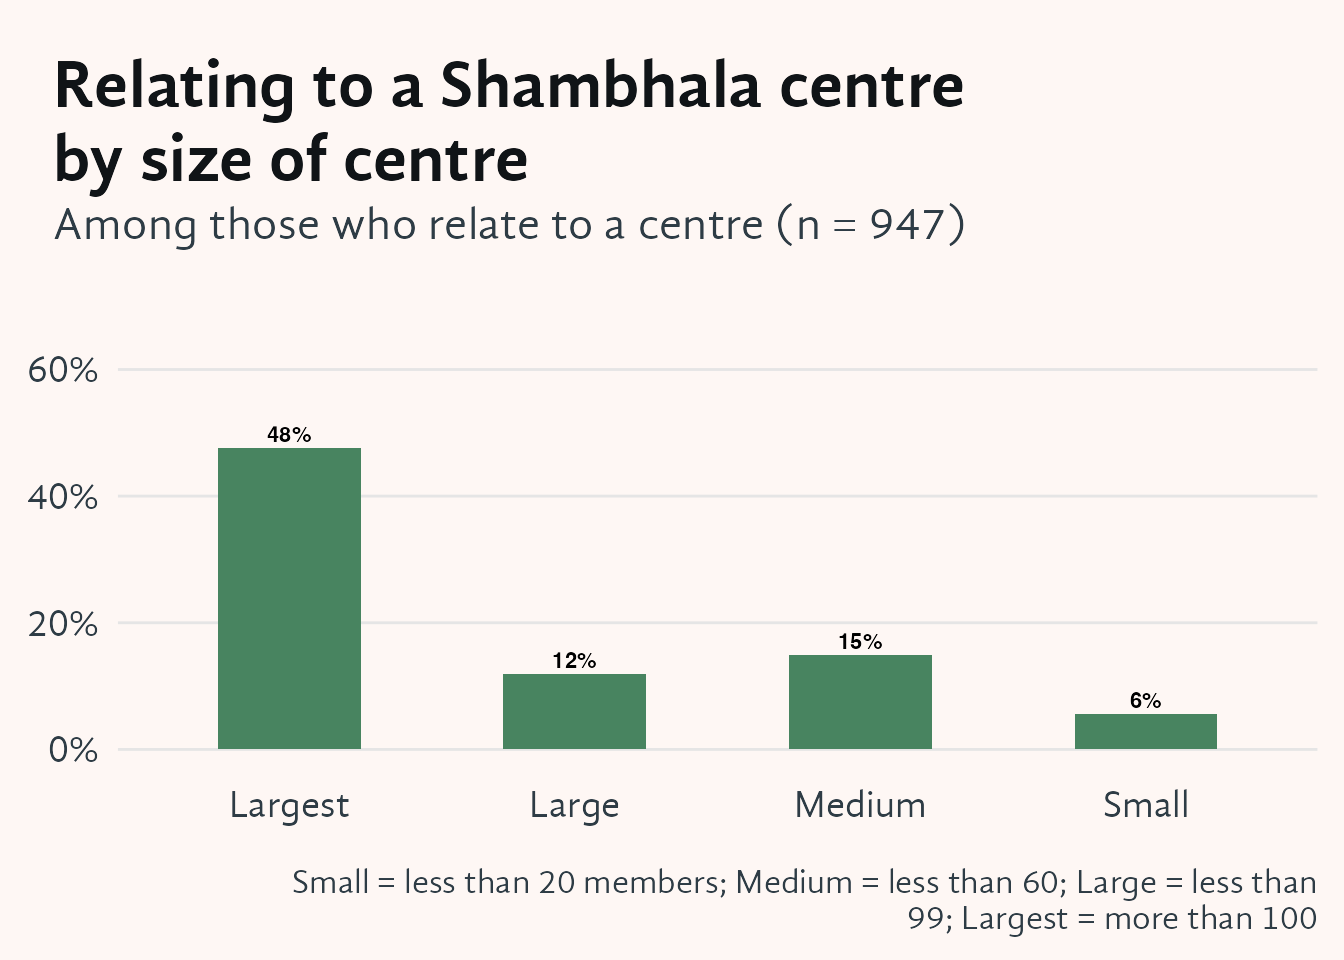
Among those who relate to a centre, roughly three quarters are affiliated with groups that have more than 60 members. Smaller centres account for a much smaller share of the affiliated respondent population.
Everyone who received a Societal Mirror survey was identified as a member or friend in the Shambhala Database. However, some people who are identified as members in the SDB do not think of themselves as members. In addition, while officially everyone in Shambhala is a global member, and those who are associated with a center are also center members, not everyone feels connected to the global community.
This survey question asks respondents who do relate to a center how they think of themselves in terms of membership. About a quarter of survey respondents who relate to a center consider themselves to be center members only, while more than half consider themselves members of both their local center and global Shambhala.
3 Perceptions of membership of those who relate to a center
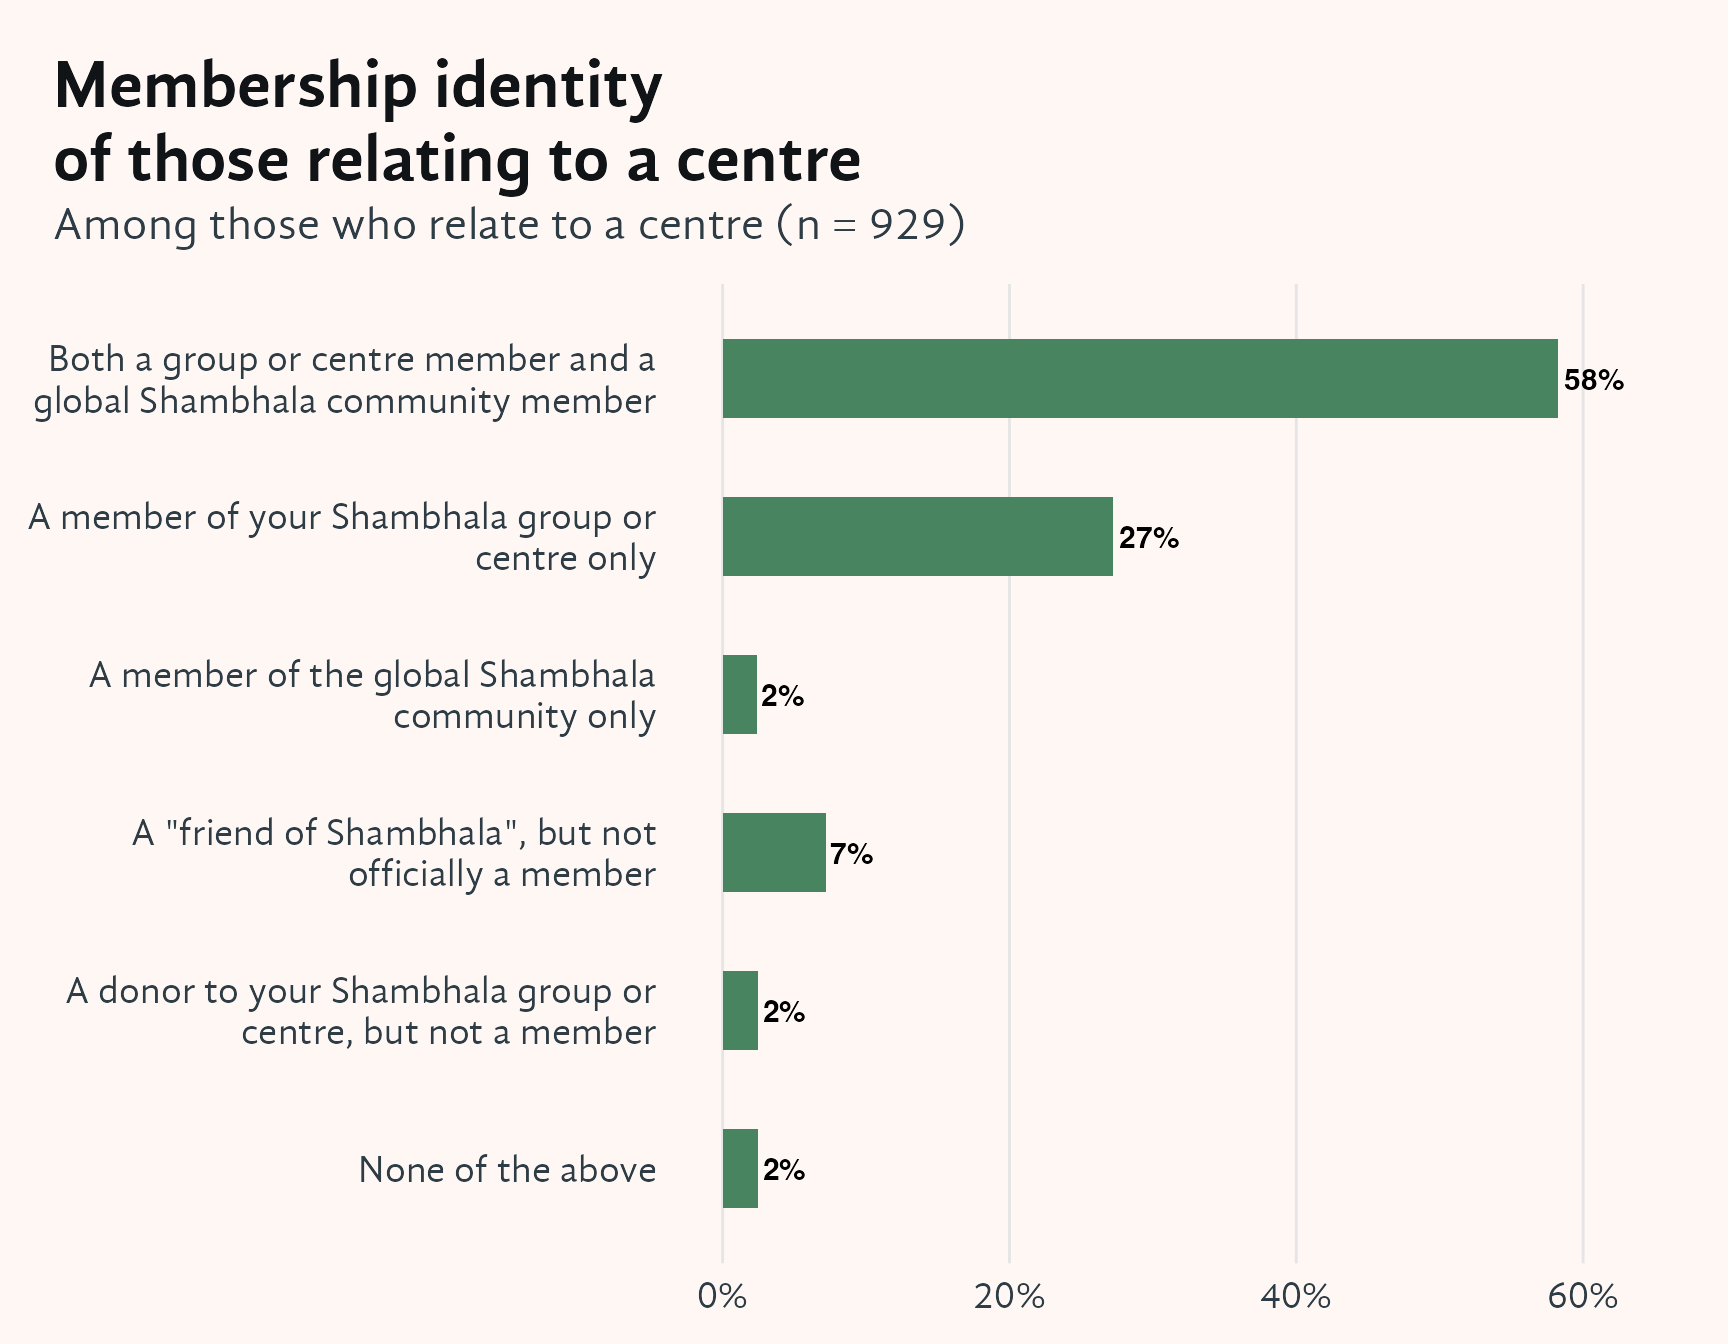
More than half of those who relate to a centre see themselves as members of both their local centre and the global Shambhala community. About a quarter identify as centre members only, with smaller shares holding other membership identities.
4 Primary membership identity by time period joined
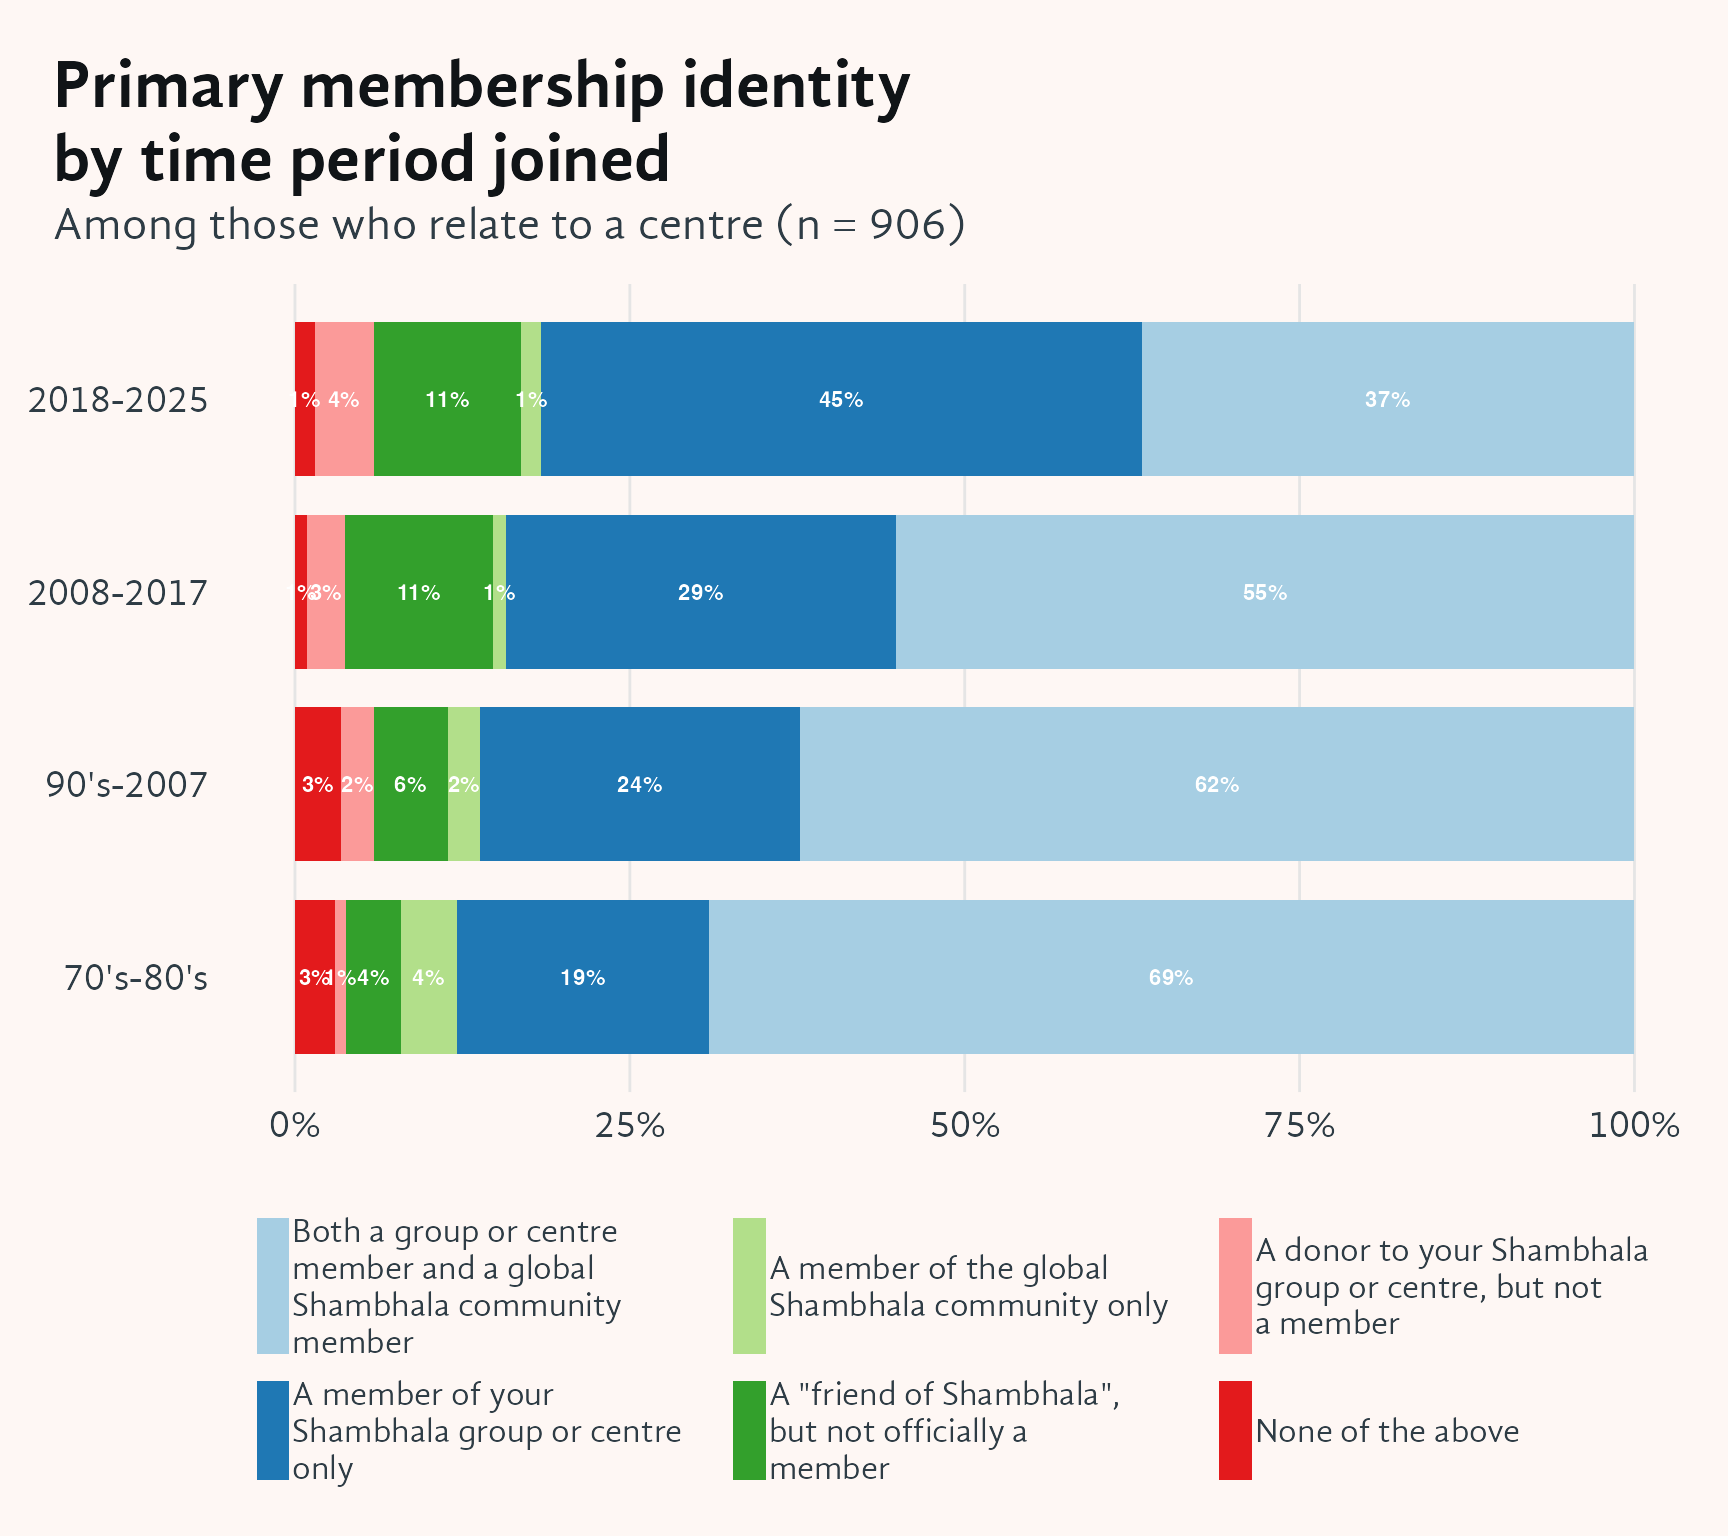
Longer-tenured members are considerably more likely to see themselves as members of both their local centre and the global Shambhala community. Those who joined more recently more often identify as centre members only, or describe themselves as friends rather than formal members.
5 Primary membership identity by centre size
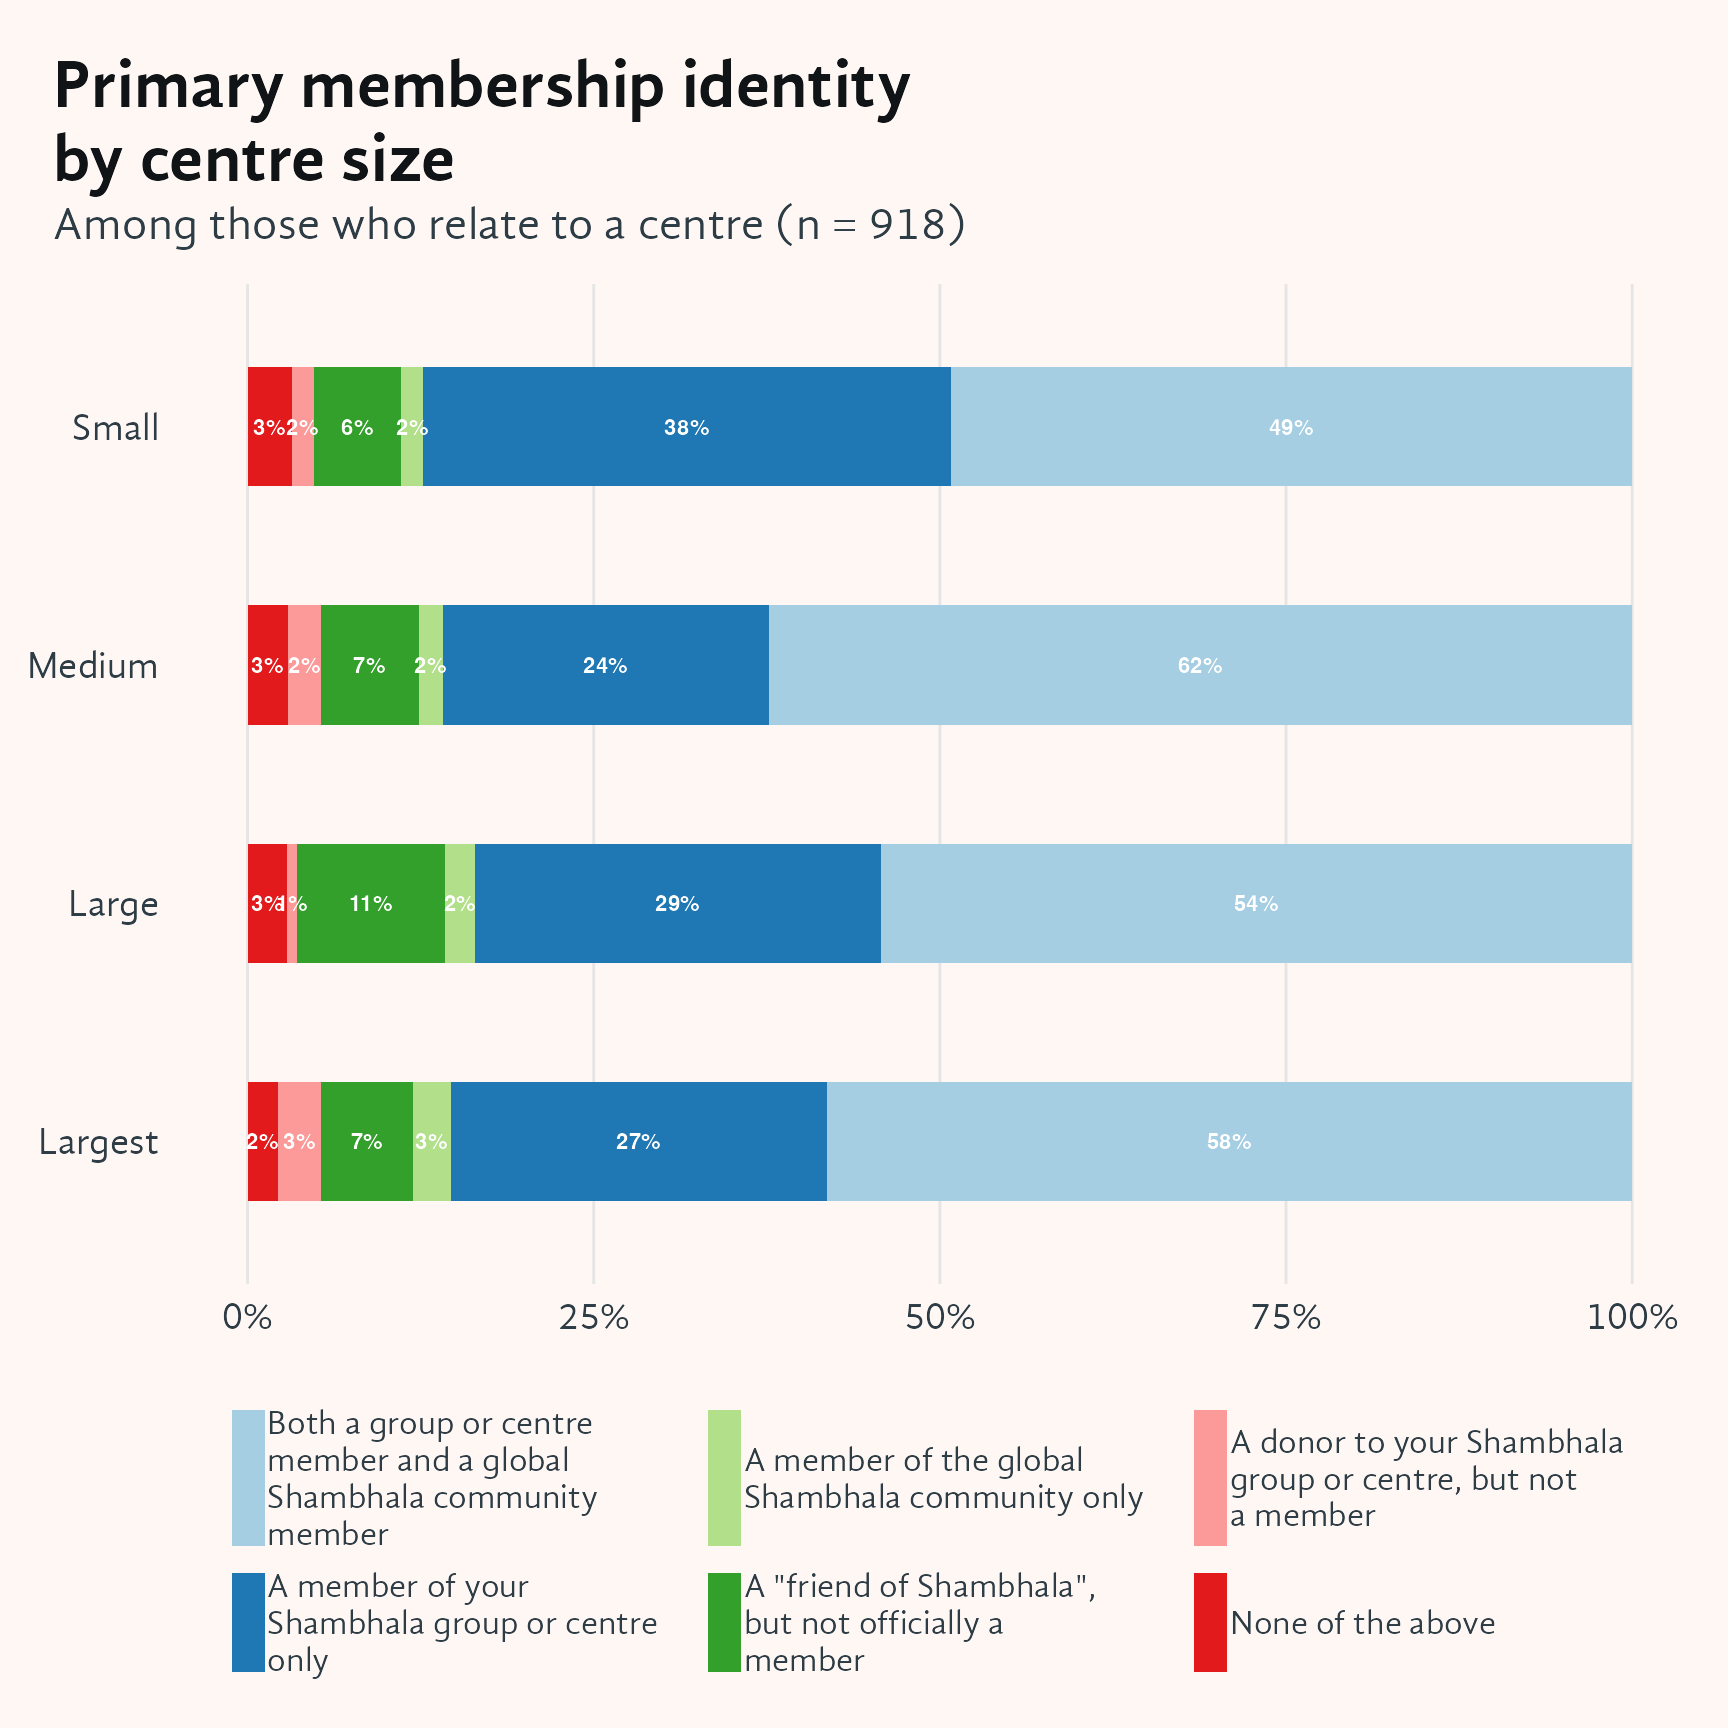
Members of the largest and medium centres are the most likely to see themselves as members of both their local centre and the global Shambhala community. Members of smaller centres more often identify as centre members only.
6 Sense of belonging by centre size among those who relate to a centre

Respondents from medium and large centres report the strongest sense of belonging among those who relate to a centre. These are also the size groups where members are most likely to identify as belonging to both their local centre and the global Shambhala community.
7 Perceptions of membership of those who do not relate to a centre

Only about a third of those who do not relate to a Shambhala centre consider themselves members of Shambhala. Not having a centre connection substantially reduces the likelihood of identifying as a member.
8 Primary membership identity by time period joined for those who do not relate to a centre

Among those not connected to a centre, older cohorts (those who joined in the 1970s and 1980s) are substantially more likely to still consider themselves Shambhala members. Those who joined more recently are less likely to identify as members at all.
9 Participation in Centre Decisions
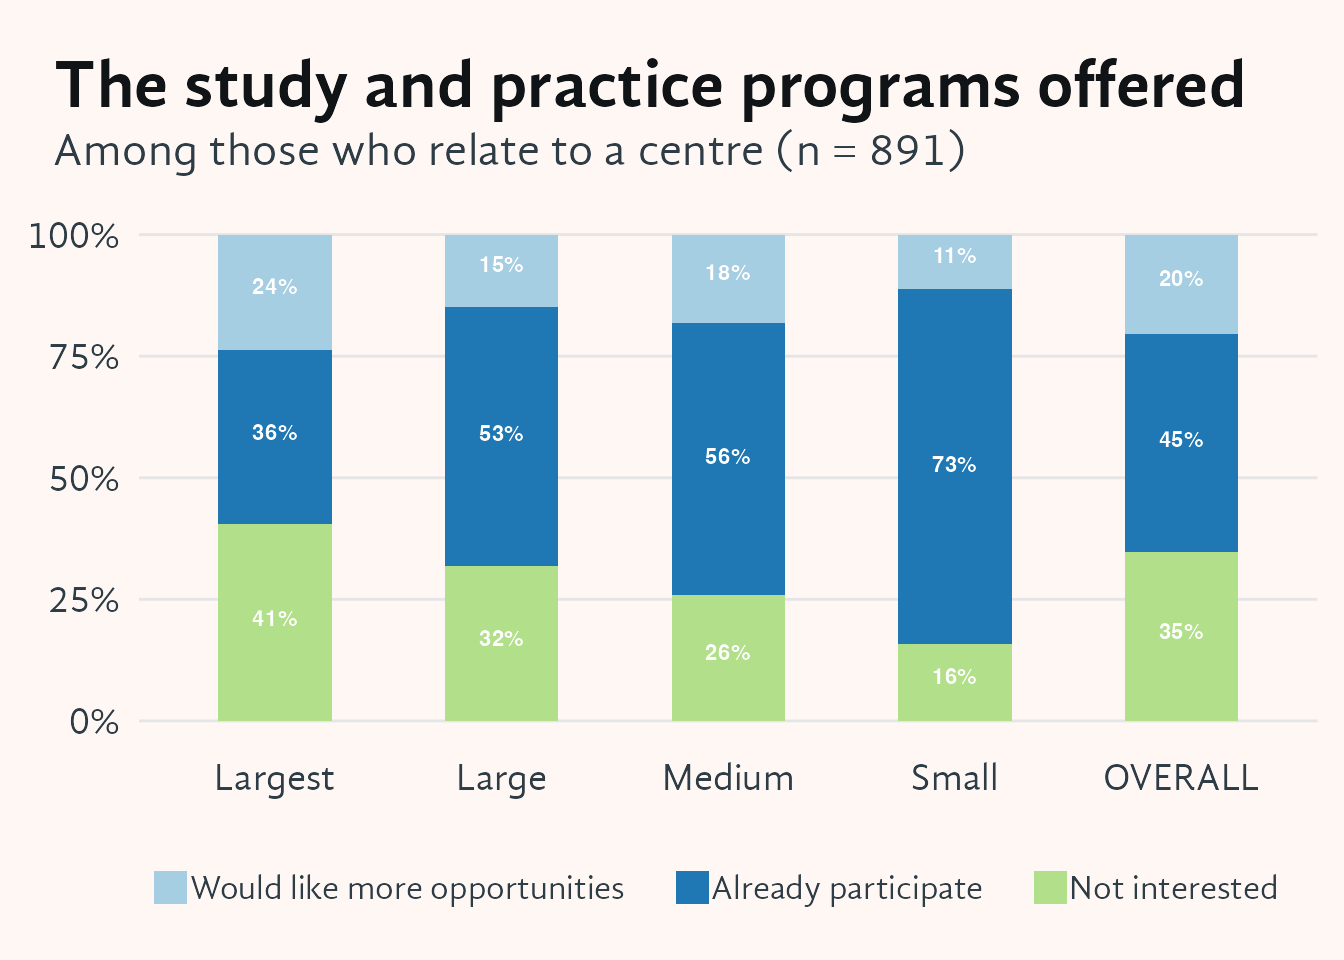
Small centre members are the most likely to already participate in decisions about study and practice programs, with participation rates roughly double those at the largest centres.

The pattern for social events mirrors that for study and practice: small centre members participate most actively, and the gap between small and large centres is substantial.
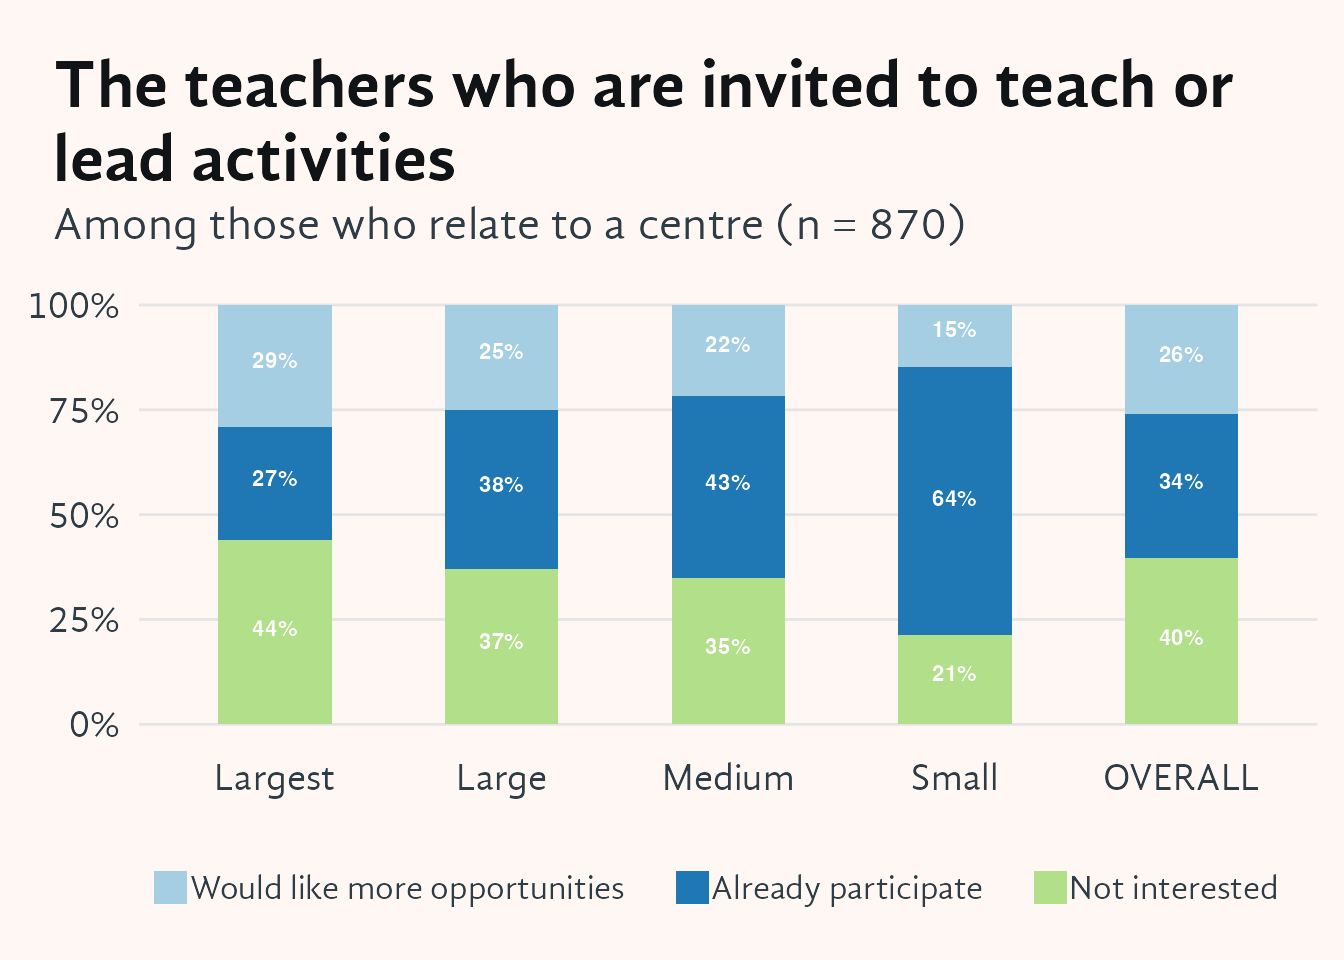
Small centre members are the most likely to already have a hand in decisions about which teachers are invited. At the largest centres, members are more likely to report no interest in participating in teacher selection.
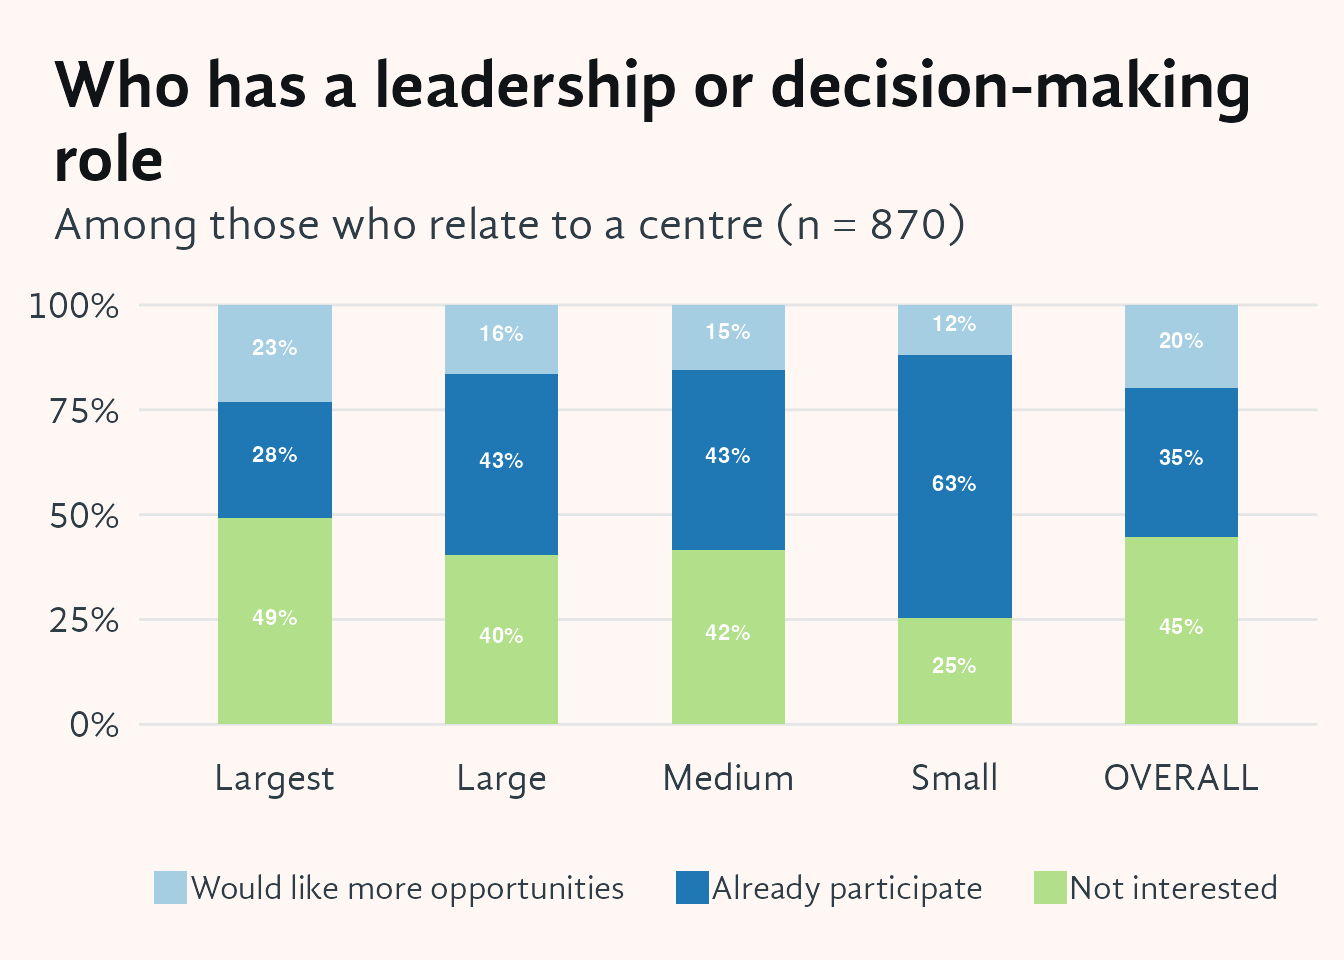
Small centre members are the most engaged in leadership decisions, with participation rates far higher than those at the largest centres, where disinterest in participating is also most common.
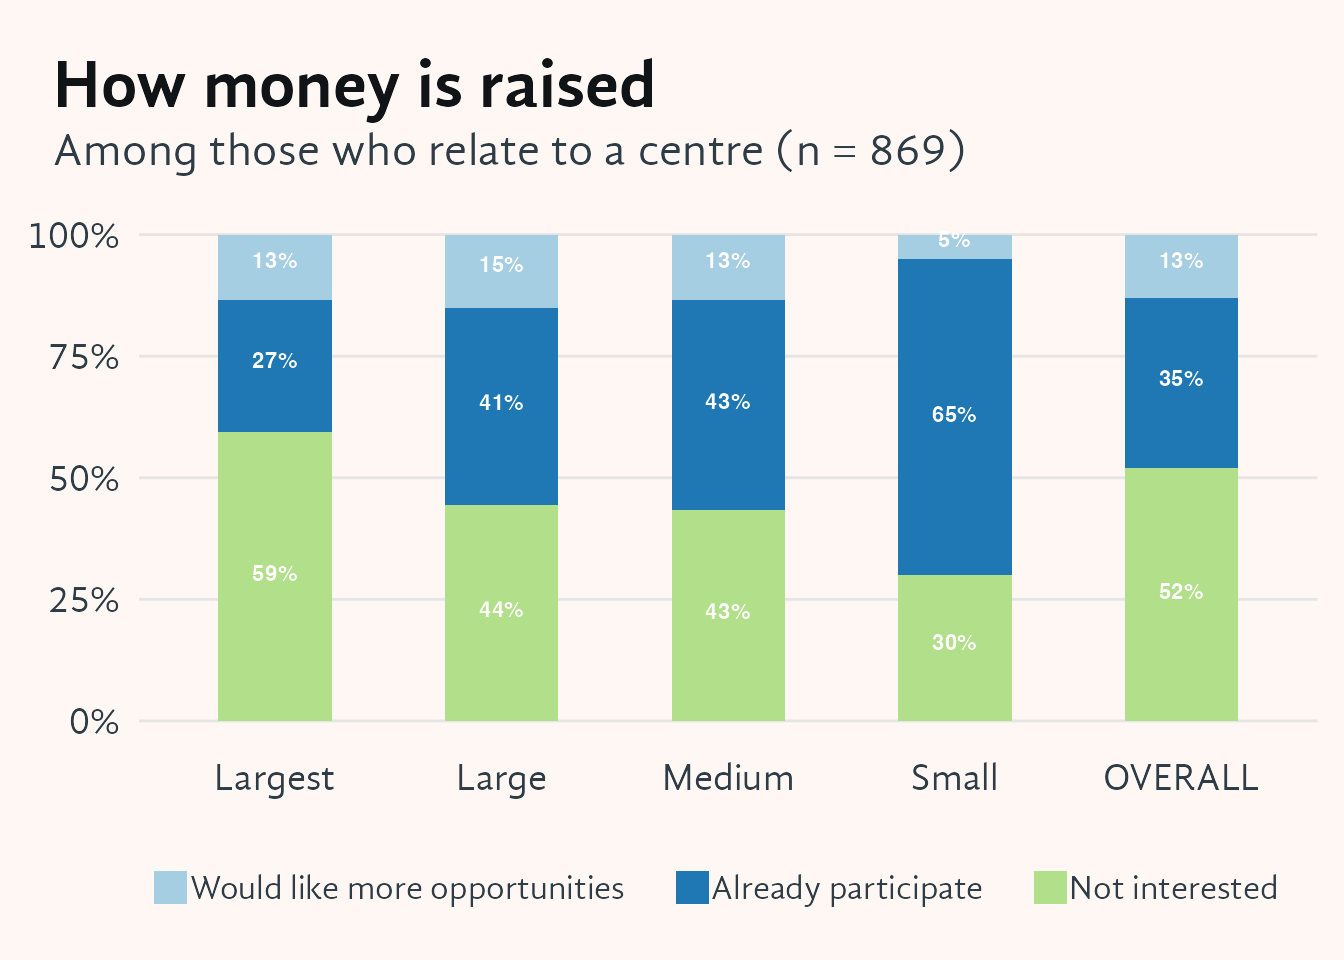
Small centre members are the most actively involved in fundraising decisions, with participation rates more than double those at the largest centres.
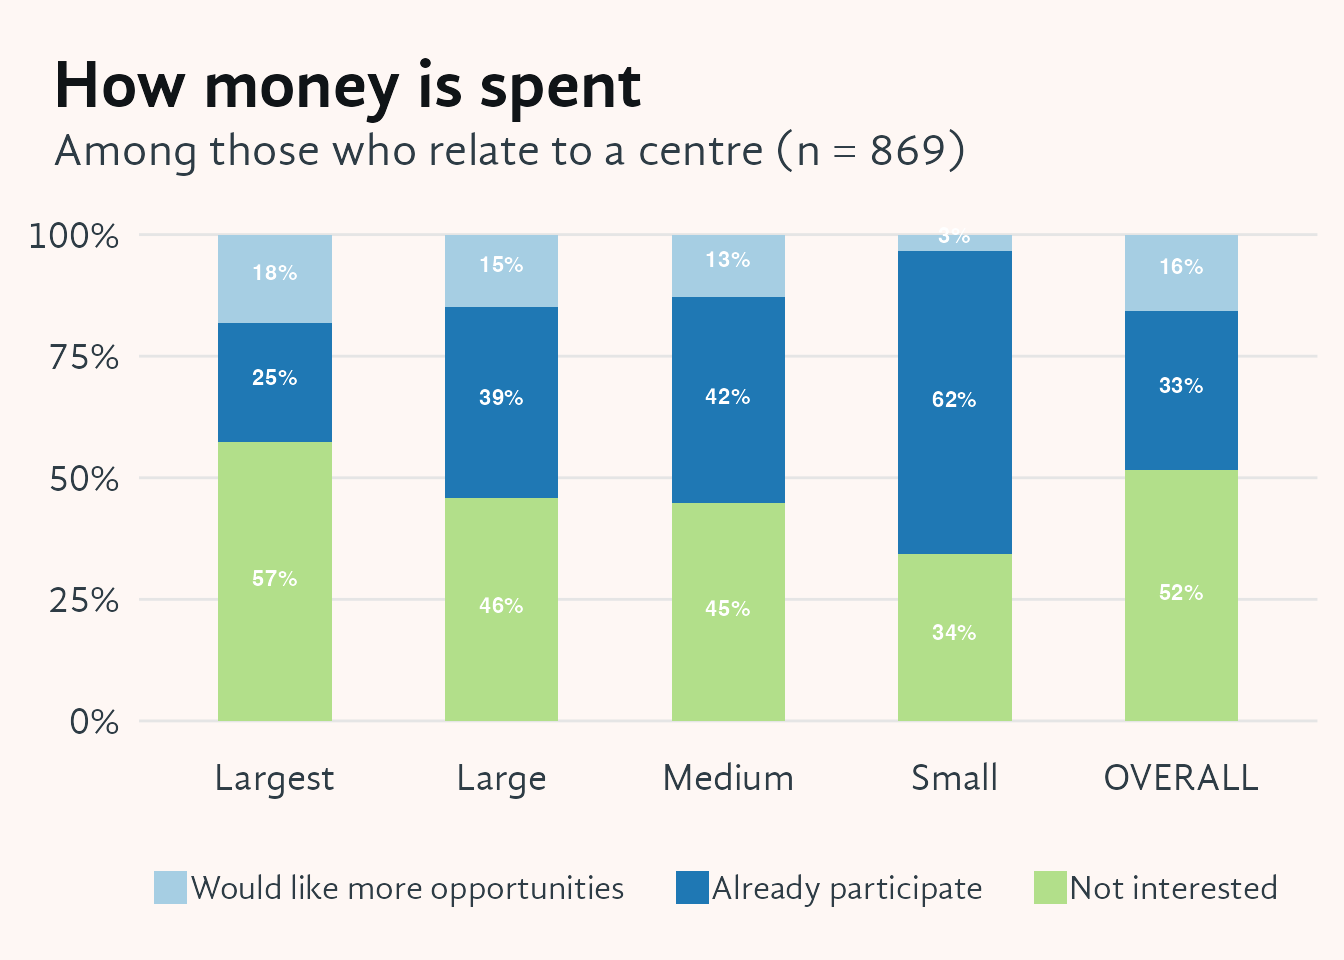
Participation in spending decisions follows the same size-based pattern: small centre members are the most involved, and the gap compared to the largest centres is pronounced.
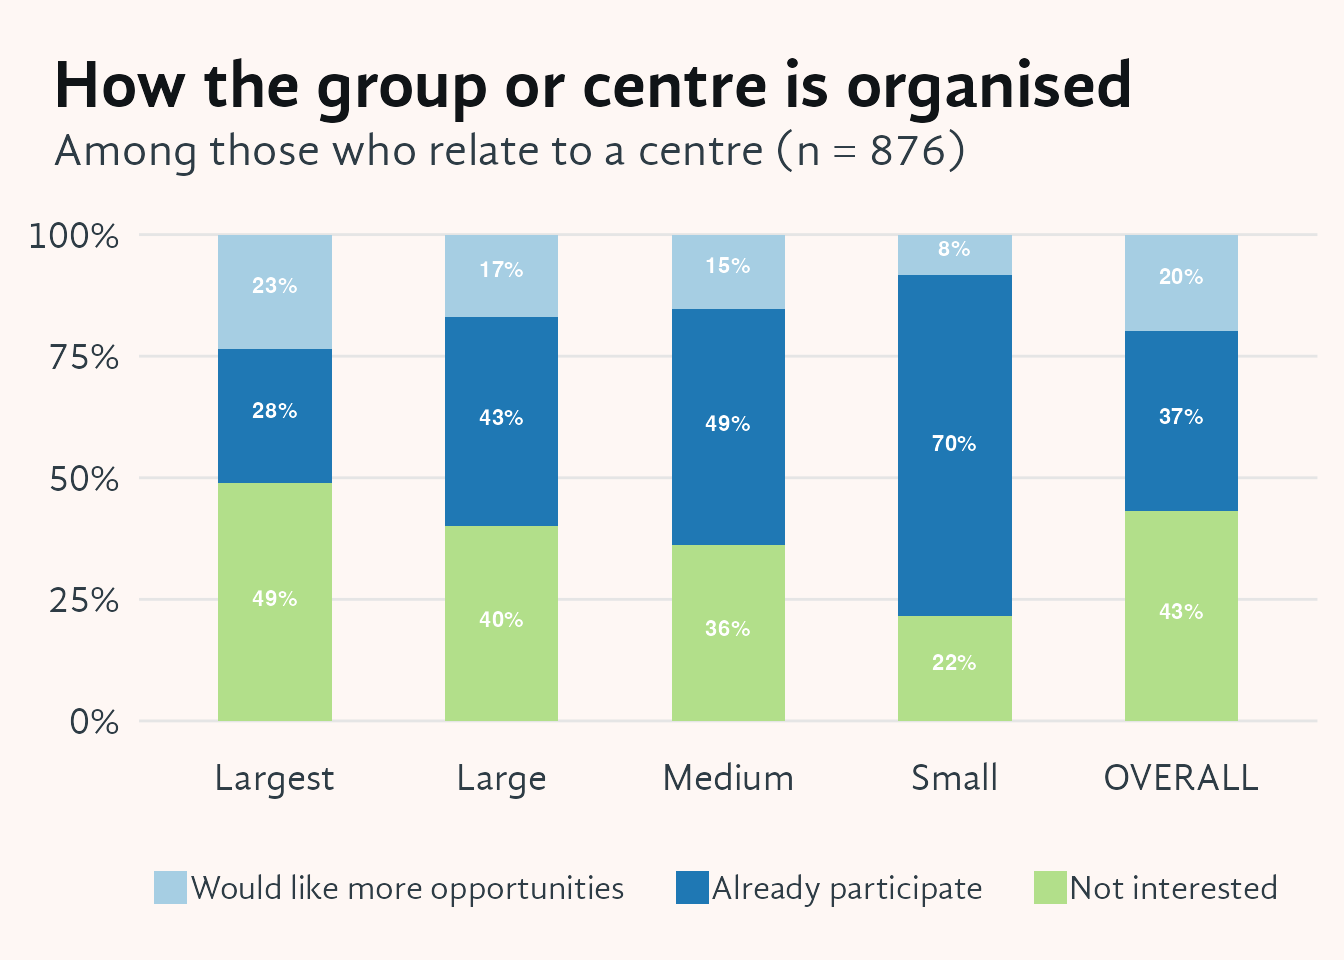
Participation in organizational decisions follows the same size-based pattern: small centre members are the most involved, and the gap compared to the largest centres is pronounced.
Overall, members of Shambhala’s smallest centres participate most in decisions. This gap is striking: more than twice as many small centre members reported participating in decisions compared to members of the largest centres. Meanwhile, members of larger centres generally said they did not want more involvement in decision-making.
10 Non-Affiliated Members
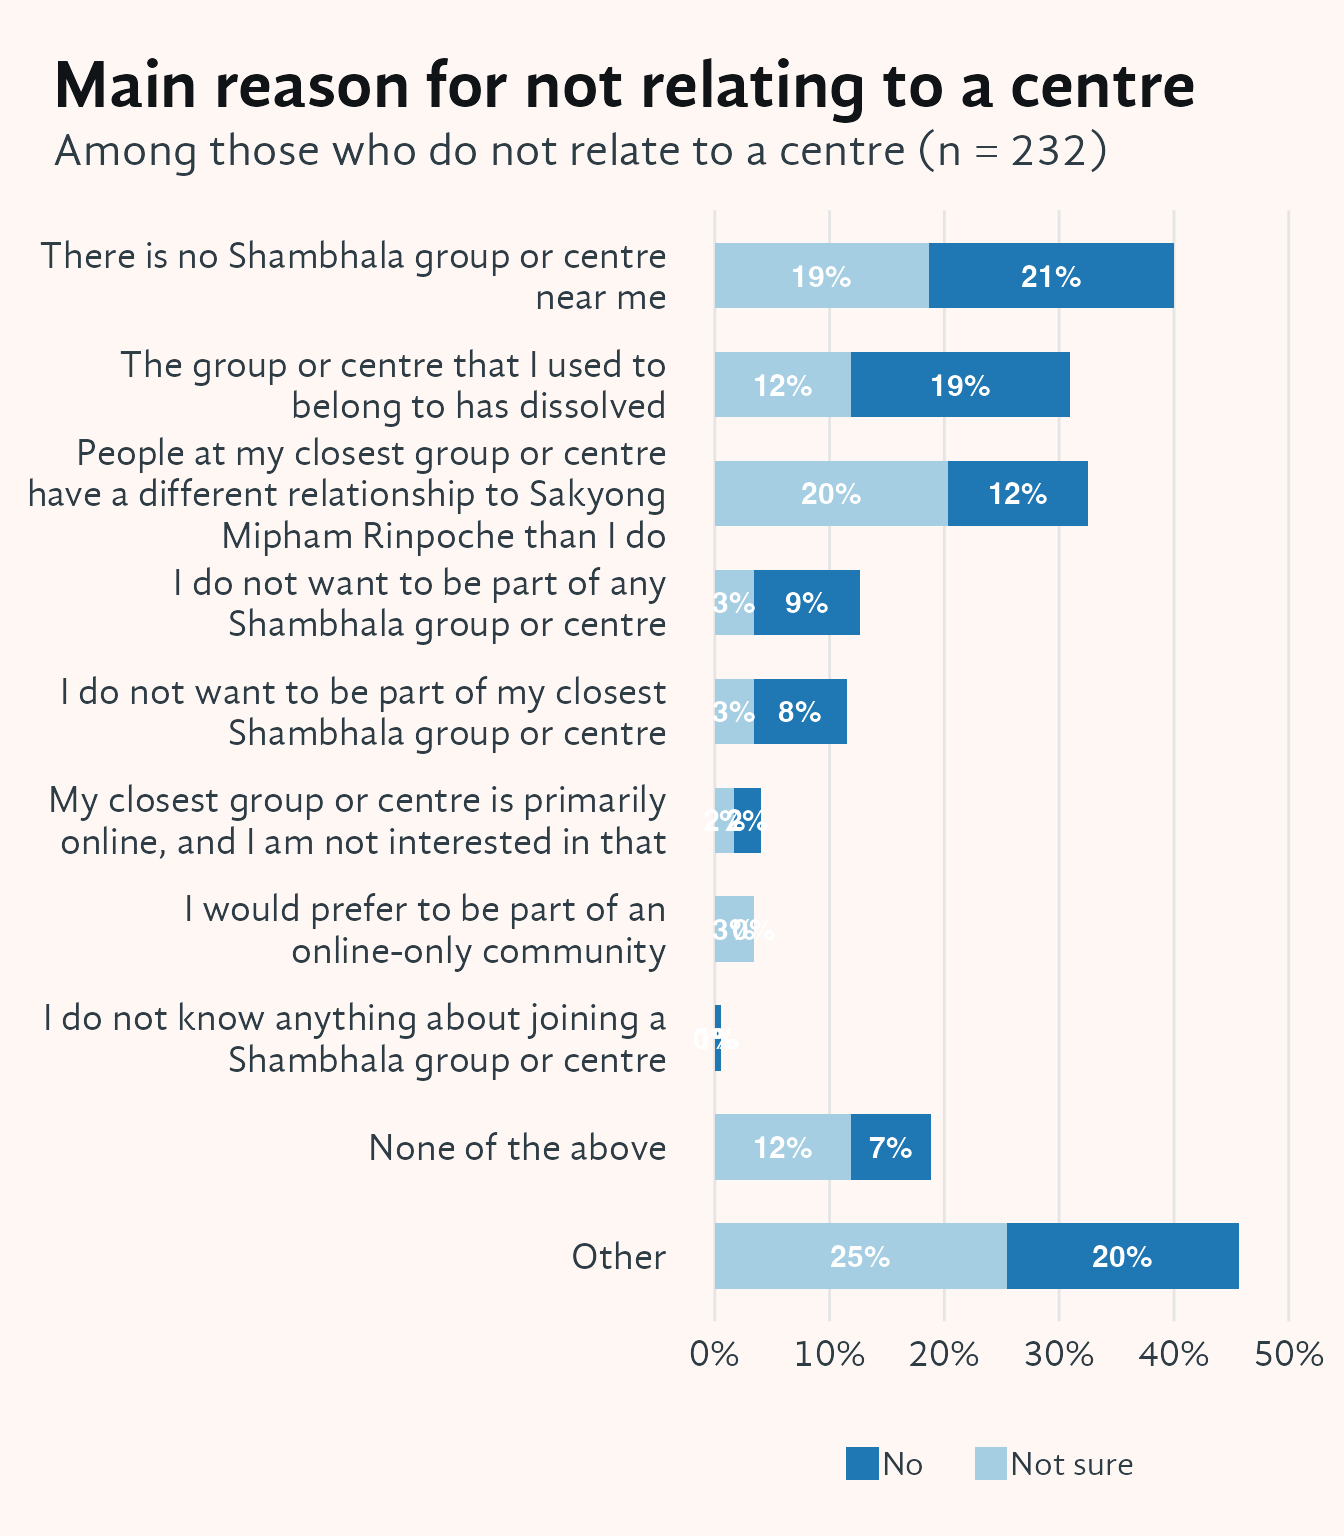
| Main reason for not relating to a centre | |||
| Among those who do not relate to a centre (n = 232) | |||
| Relate to a centre - No | Relate to a Centre - Not Sure | Overall Percentage | |
|---|---|---|---|
| Other | 20% | 25% | 22% |
| There is no Shambhala group or centre near me | 21% | 19% | 21% |
| The group or centre that I used to belong to has dissolved | 19% | 12% | 17% |
| People at my closest group or centre have a different relationship to Sakyong Mipham Rinpoche than I do | 12% | 20% | 14% |
| I do not want to be part of any Shambhala group or centre | 9% | 3% | 8% |
| I do not want to be part of my closest Shambhala group or centre | 8% | 3% | 7% |
| My closest group or centre is primarily online, and I am not interested in that | 2% | 2% | 2% |
| I would prefer to be part of an online-only community | 0% | 3% | 1% |
| I do not know anything about joining a Shambhala group or centre | 1% | 0% | 0% |
| None of the above | 7% | 12% | 8% |
95% of those who do not relate to a centre now had previously been a member of a center.
The table shows the reasons 232 survey respondents do not relate to a Shambhala group or centre, sorted by the “No” and “Not sure” combined. Top reasons: no nearby centre (21%), dissolved group or centre (17%), followed by relationship differences with Sakyong Mipham Rinpoche (14%).
Of the 22% who responded “other”, 46 offered additional comments. These comments fell into two main categories. The first described various experiences of alienation, either from a local group or centre or from Shambhala generally:
Examples…
The second comment category was from people who were too busy and/or found that the center was not appealing, conveniently located, or open when they could participate:
Examples…
45 of the 238 respondents to the question of whether they are interested in organised efforts to help them connect with others in Shambhala offered additional comments. All described varying degrees of alienation from Shambhala, or well-wishes but no interest in deeper involvement.
11 Do you think of yourself as a member of Shambhala now?
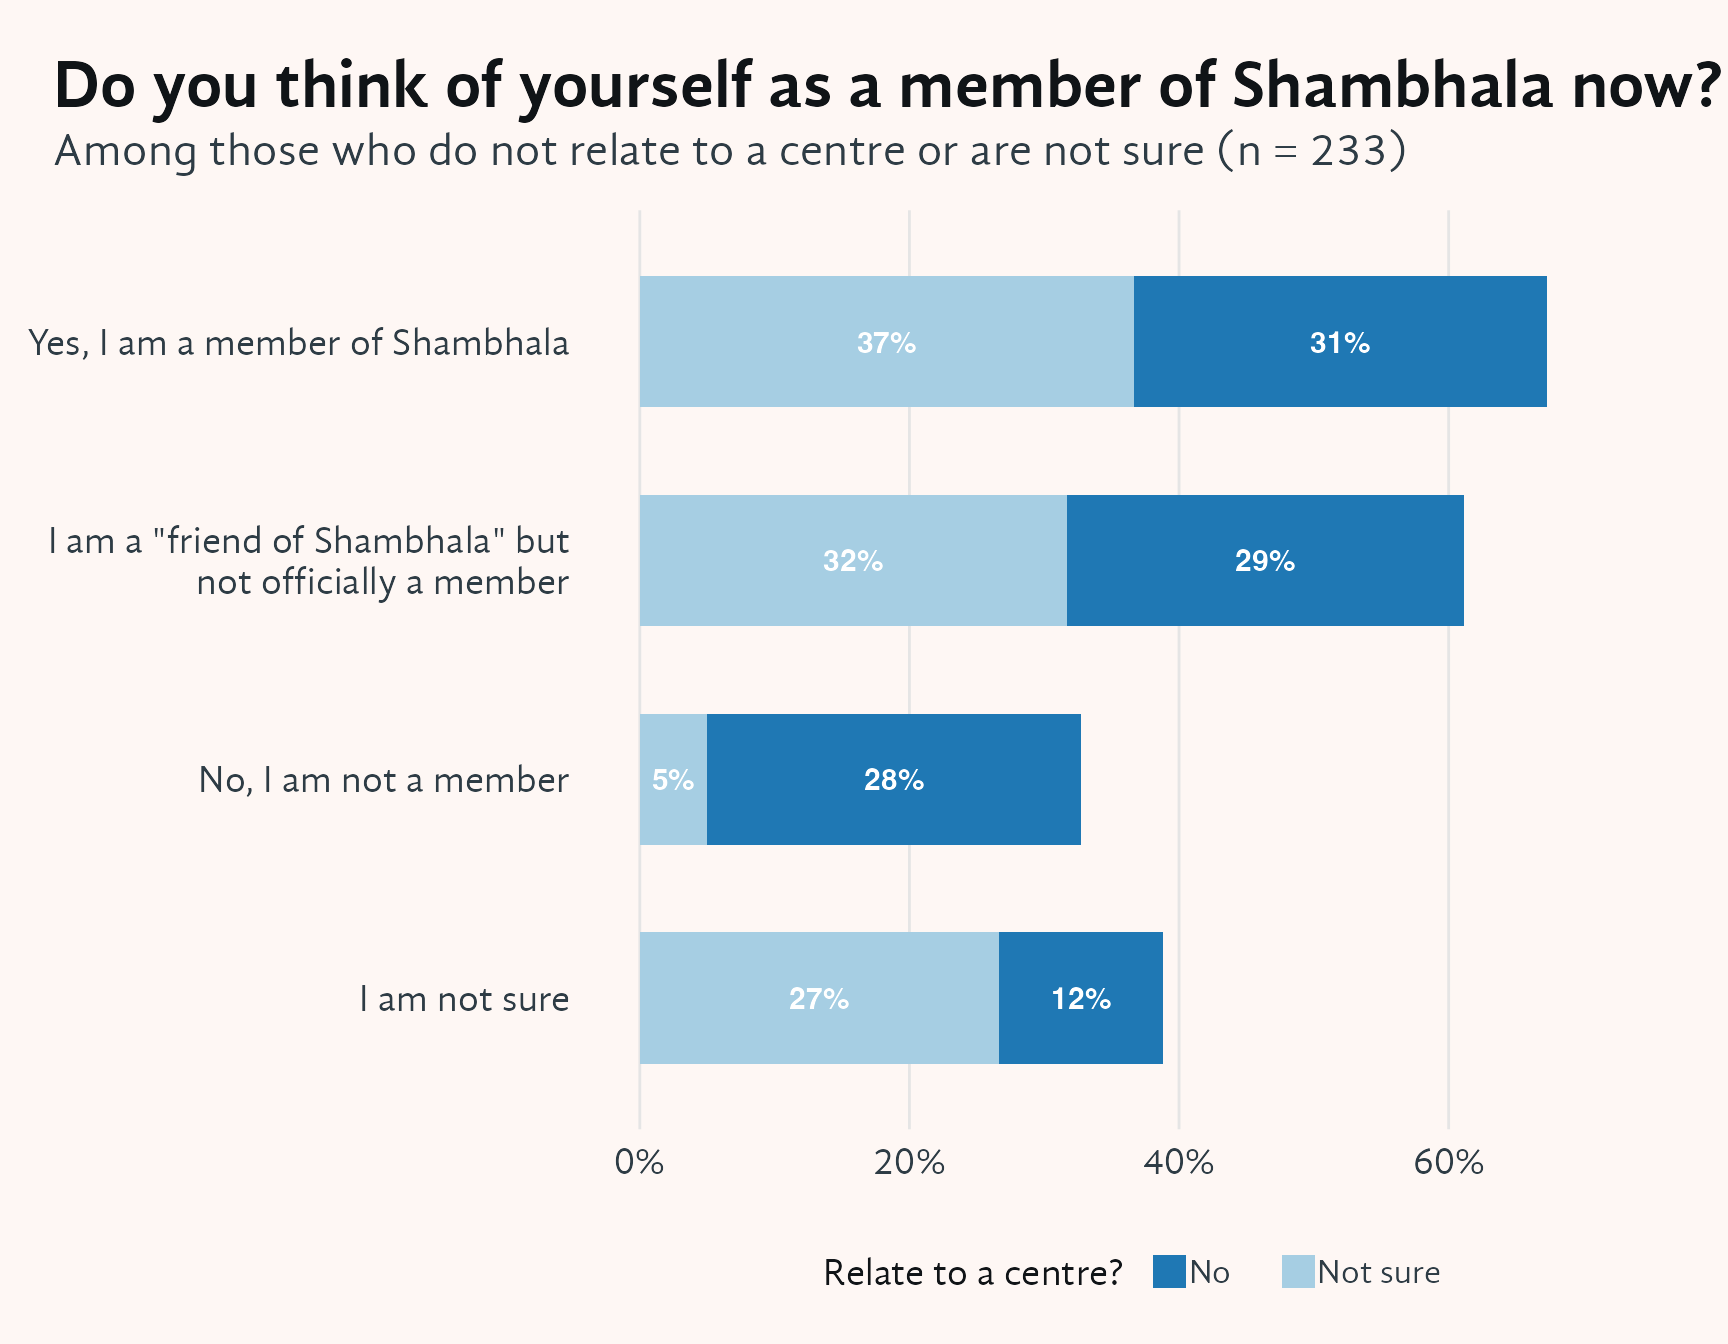
| Do you think of yourself as a member of Shambhala now? | |||
| Among those who do not relate to a centre (n = 232) | |||
| q0071 | Relate to a centre - No | Relate to a Centre - Not Sure | Overall Percentage |
|---|---|---|---|
| Yes, I am a member of Shambhala | 31% | 37% | 32% |
| I am a "friend of Shambhala" but not officially a member | 29% | 32% | 30% |
| No, I am not a member | 28% | 5% | 22% |
| I am not sure | 12% | 27% | 16% |
A surprising percentage of how who do not related to a group or centre reported that they were either members or friends of Shambhala.
12 Interest in efforts to help connection among those who are not affiliated with a group or centre
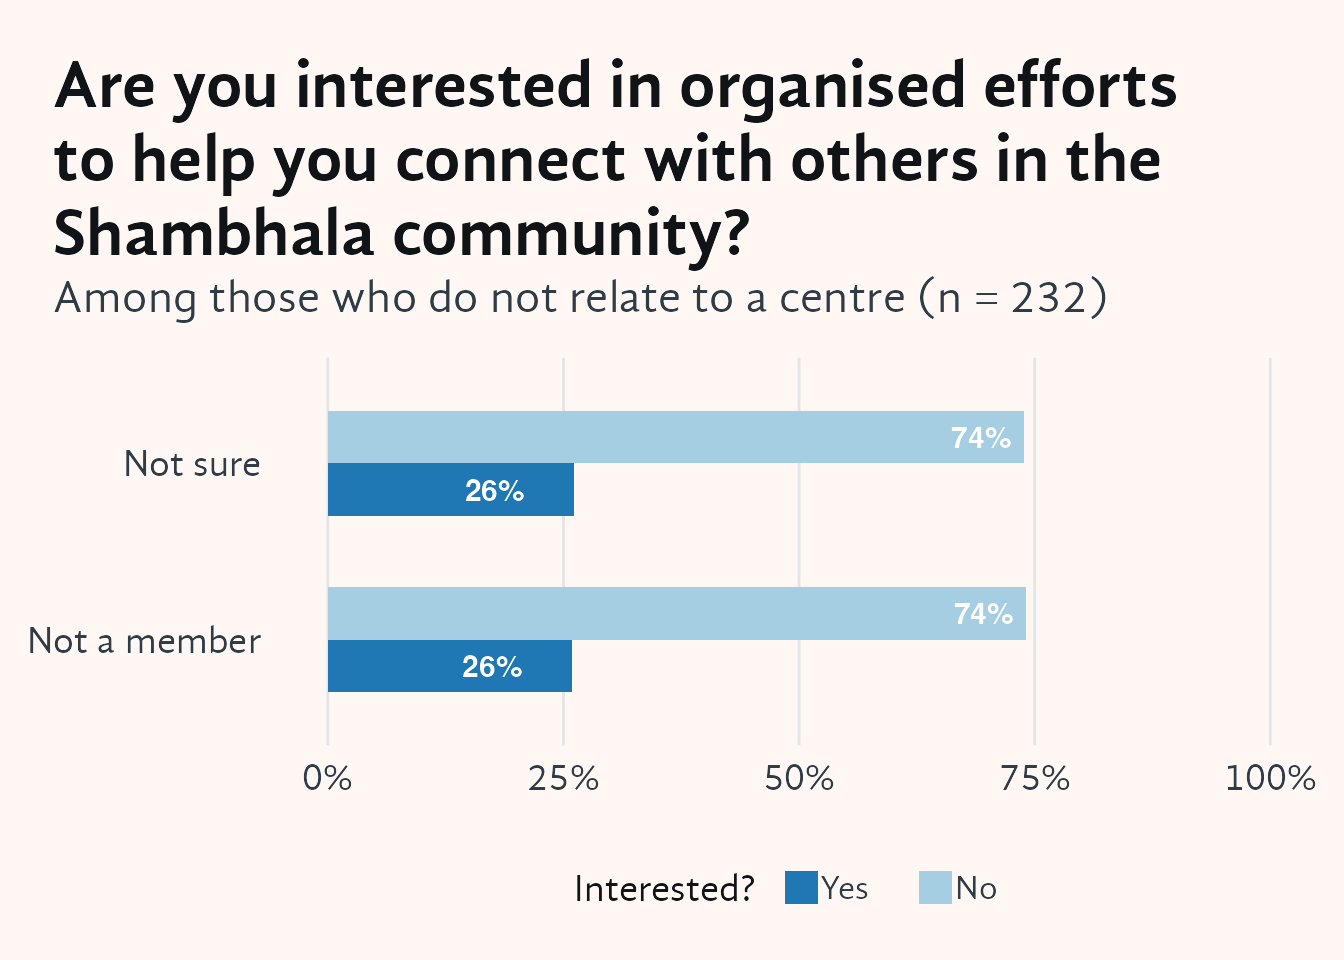
| Are you interested in organised efforts to help you connect with others in the Shambhala community? | ||
| Among those who do not relate to a centre (n = 232) | ||
| Member of Shambhala? | Yes | No |
|---|---|---|
| Not a member | 25.9% | 74.1% |
| Not sure | 26.1% | 73.9% |
A majority of those who do not relate to a group or centre are not interested in organized efforts to connect with others in the Shambhala community.
13 Interest in different ways to connect with others in the Shambhala community
| How helpful would each of these be for helping you to connect more with others in Shambhala? | |||
| Among those who do not relate to a centre and responded to this question (n = 39) | |||
| Very helpful | Somewhat helpful | Not helpful or not interested | |
|---|---|---|---|
| Being part of a virtual Shambhala center that would gather consistently online | 37% | 37% | 26% |
| Connecting to a Shambhala center remotely | 32% | 36% | 32% |
| Affiliating with other groups in Shambhala, such as the Dorje Kasung or Touching the Earth | 27% | 39% | 34% |
| Participating as a volunteer in a Shambhala activity | 40% | 33% | 26% |
The responses here show strong interest among respondents for the itemised initiatives to help them connect more to others in Shambhala.