
Enrollment overview

1 Program registrants by membership category
Non-members are a critical element of the Shambhala community, and in particular are the majority of individuals participating in centre and group programming.
Non-members have consistently formed the largest group of individuals enrolling in Shambhala programs each year, outnumbering formal members throughout the period from 2016 to 2025. All three membership types dropped sharply around 2020 and have only partially recovered since.
| Annual registrants by final membership status | |||||||||||
| Member type | 2016 | 2017 | 2018 | 2019 | 2020 | 2021 | 2022 | 2023 | 2024 | 2025 | |
|---|---|---|---|---|---|---|---|---|---|---|---|
| Non-Member | 14,334 | 14,568 | 12,587 | 9,741 | 7,993 | 6,406 | 5,341 | 6,273 | 5,900 | 6,769 | |
| Member | 3,254 | 3,024 | 2,798 | 2,654 | 2,787 | 2,419 | 2,258 | 2,428 | 2,158 | 2,224 | |
| Friend of Shambhala | 913 | 890 | 872 | 613 | 575 | 445 | 403 | 412 | 347 | 333 | |
| Total | — | 18,501 | 18,482 | 16,257 | 13,008 | 11,355 | 9,270 | 8,002 | 9,113 | 8,405 | 9,326 |
2 Importance of non-member registrants in 2025

Centres and groups draw a substantially higher share of non-member registrations than Shambhala Online. At in-person centres and groups, non-members make up the majority of those registering for programs, while Shambhala Online serves a higher proportion of members and friends relative to non-members.
Number of individuals registering in:
|
||
|---|---|---|
| Shambhala Online | Centres and Groups | |
| Non-members registering | 1,058 | 5,940 |
| All registrants | 2,396 | 7,920 |
| Percent non-members | 44.2% | 75.0% |
3 Online and in-person enrollments over time
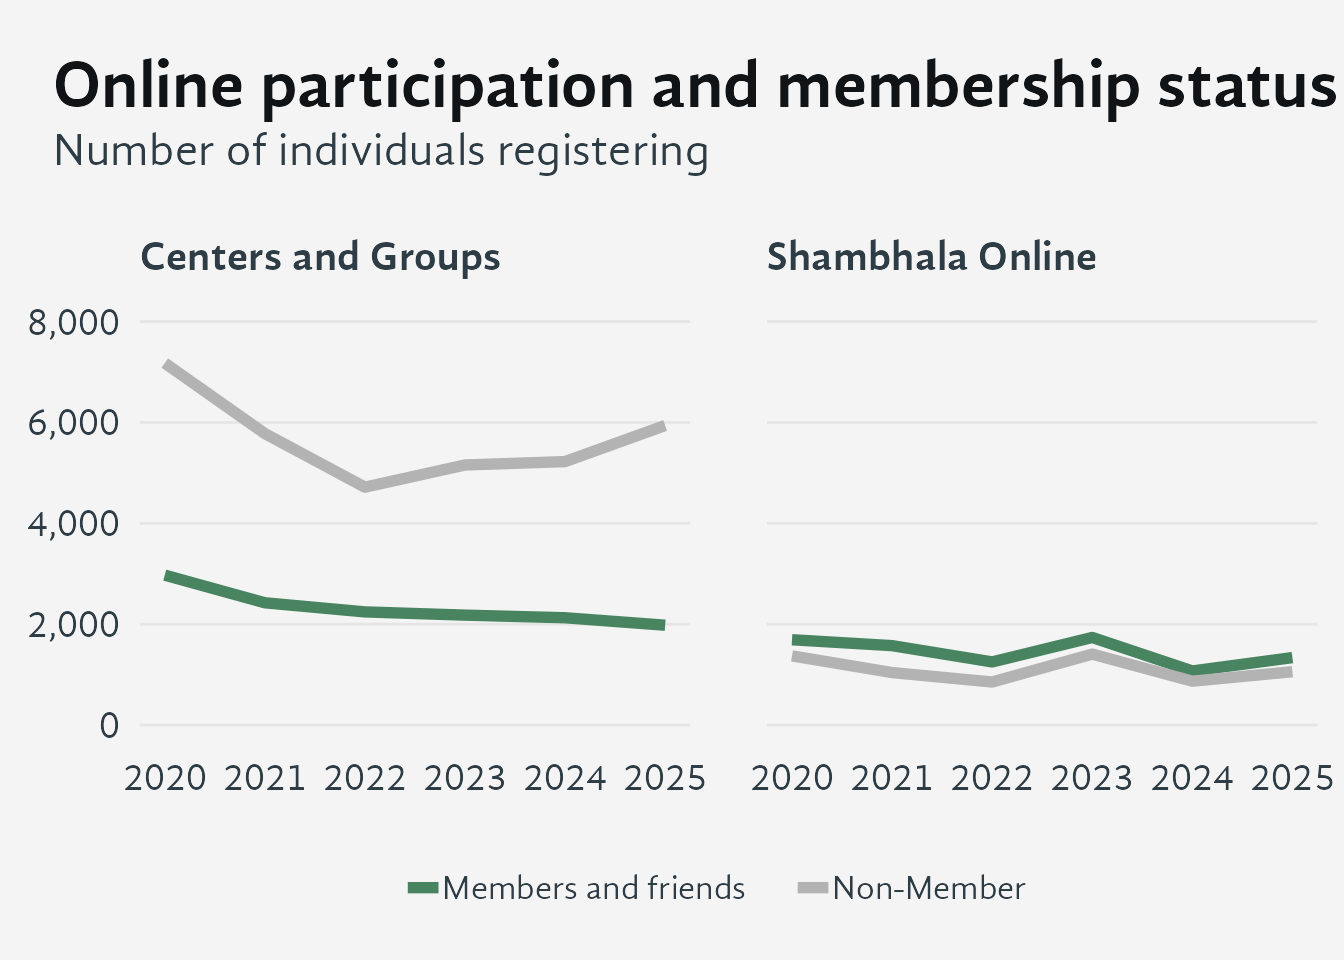
Non-members outnumber members and friends at centres and groups across the full period shown. The two groups track each other closely at Shambhala Online, where overall volumes are smaller. Both venue types saw enrollment drop around 2020 and have recovered to varying degrees since.
| Number of individuals participating | ||||
| Year |
Members and Friends
|
Non-Members
|
||
|---|---|---|---|---|
| Centers | Shambhala Online |
Centers | Shambhala Online |
|
| 2020 | 2,973 | 1,692 | 7,178 | 1,372 |
| 2021 | 2,425 | 1,575 | 5,780 | 1,041 |
| 2022 | 2,244 | 1,252 | 4,717 | 854 |
| 2023 | 2,180 | 1,737 | 5,157 | 1,407 |
| 2024 | 2,128 | 1,073 | 5,224 | 870 |
| 2025 | 1,980 | 1,338 | 5,940 | 1,058 |
4 Where people enroll – between their Home Center, Shambhala Online, and Another Center
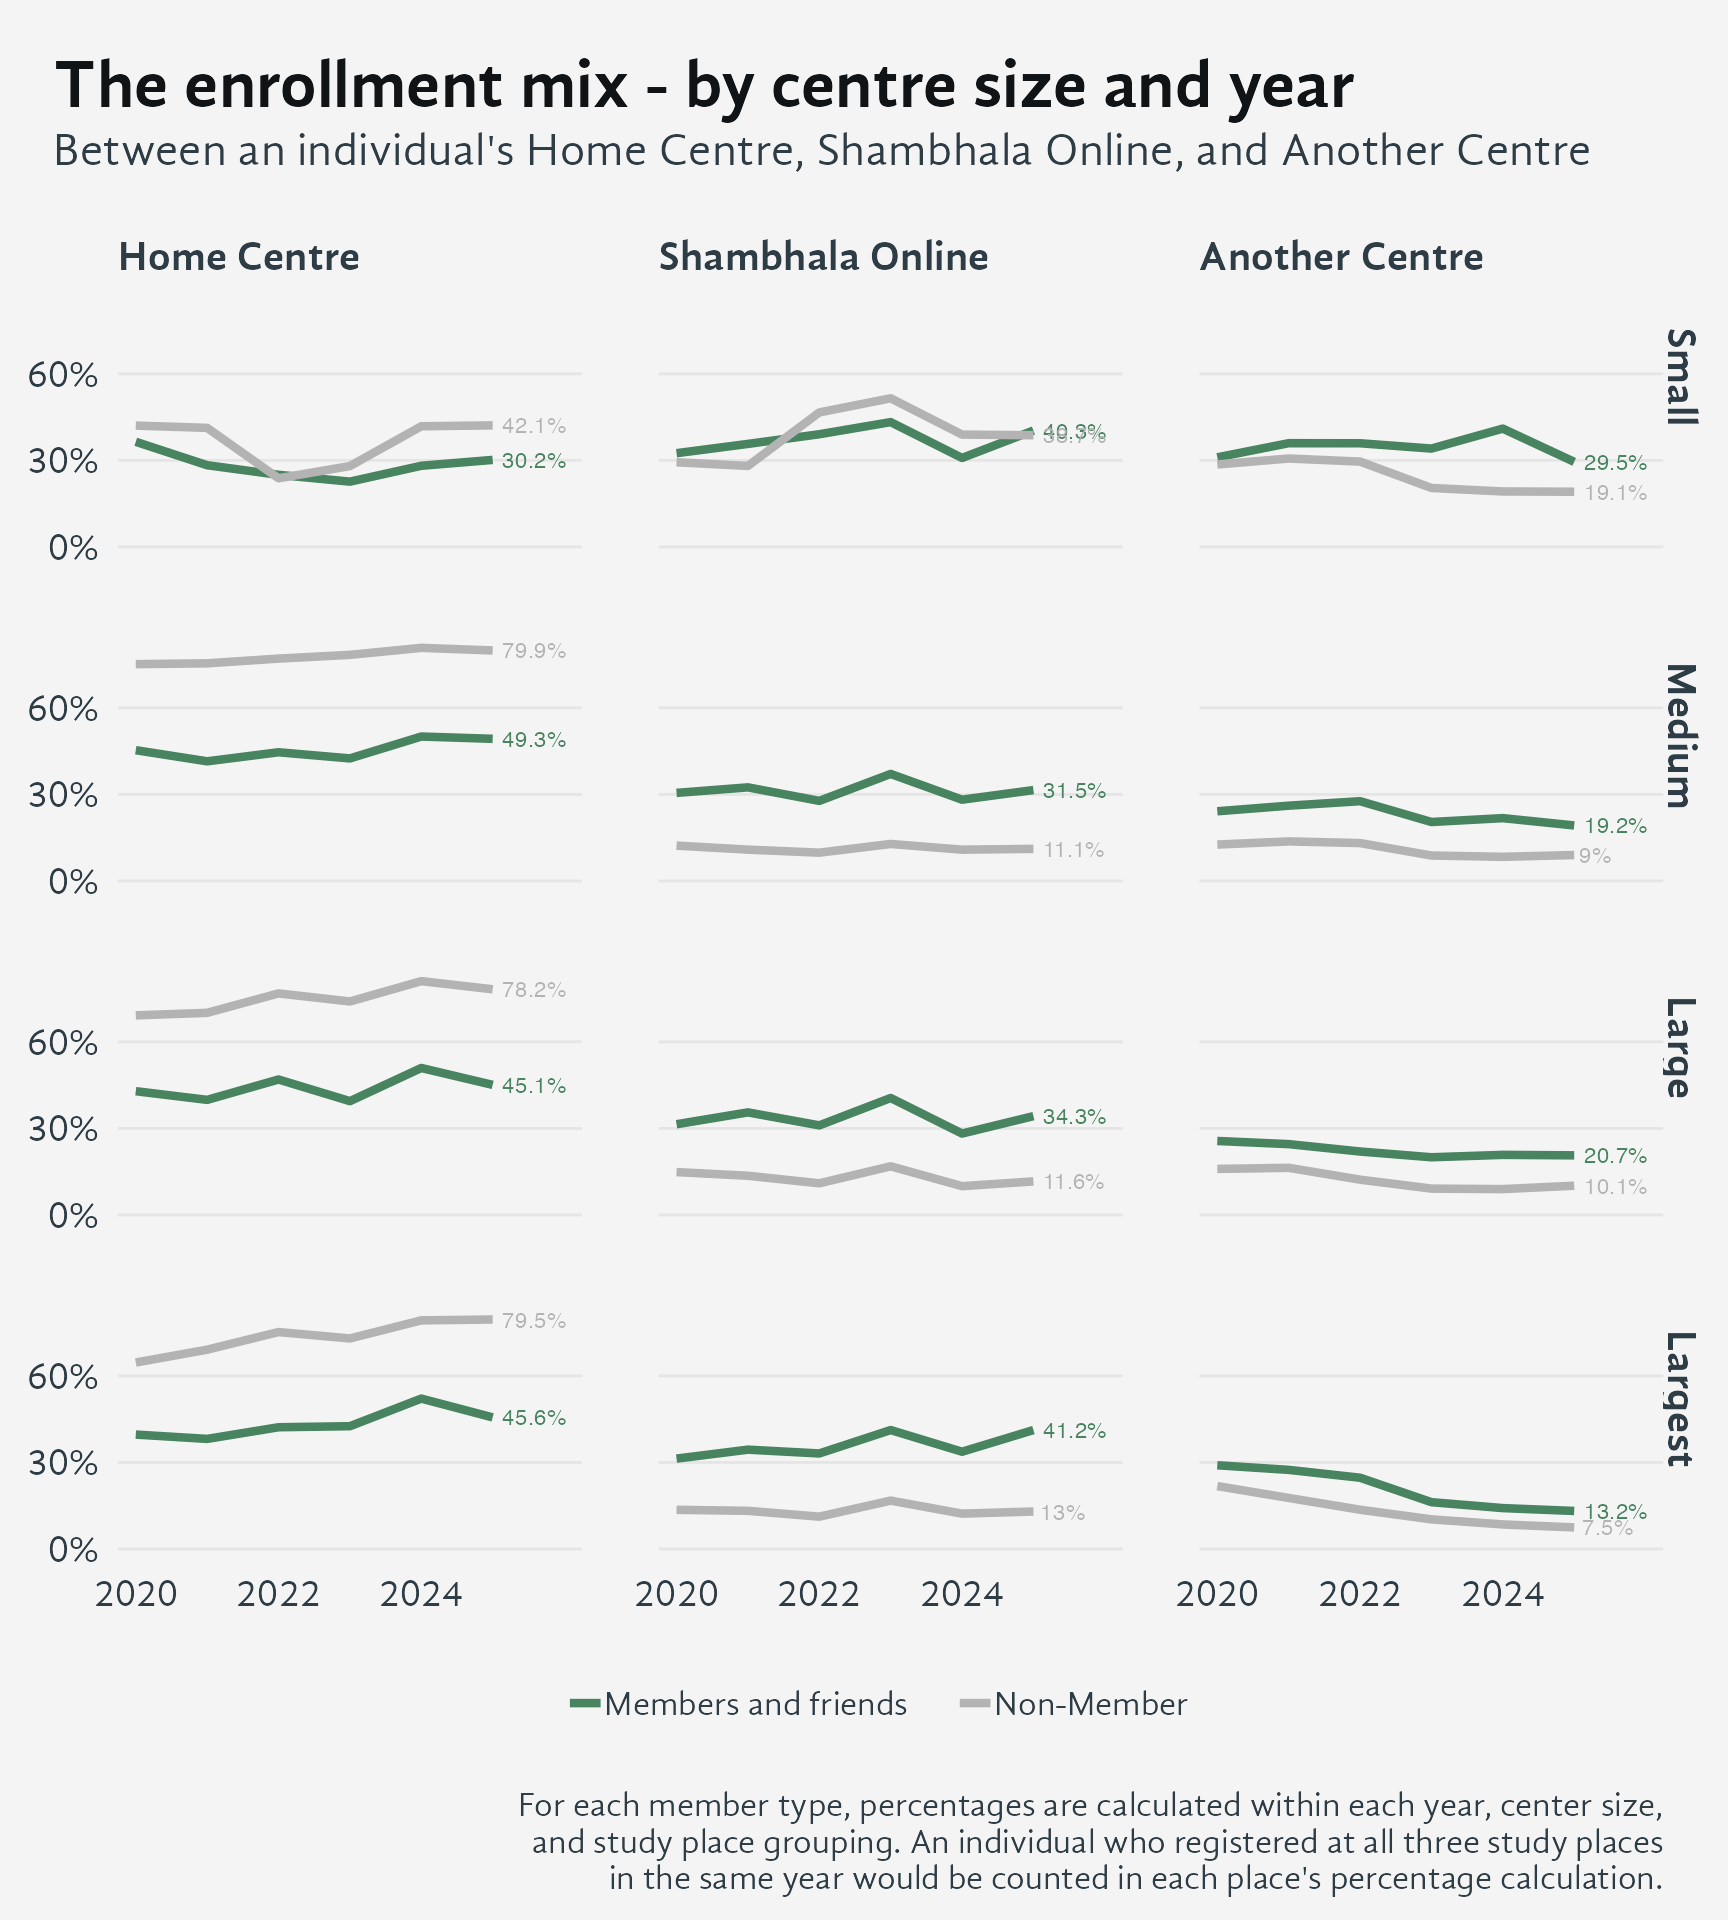
This graph requires some explanation. For each year, centre size, and study place grouping, the percentage of individuals enrolling is calculated separately for members and friends versus non-members. For example, looking at the Medium Centre row, in 2025 about 50% registered at their Home Centre, 32% registered at Shambhala Online, and 19% registered at another centre. For centres of that size, 80% of Non-Members registered at their “Home Centre”.
5 Continuing participation
This section presents patterns of registration for people who first registered for any program after 2018. In almost all cases, those people were completely new to Shambhala, although there were some instances of people who had connected much earlier than 2018 but had simply not registered in the SDB since it became our record-keeping reference point. Participants who continue along a path of study go deeper and enrich the community.
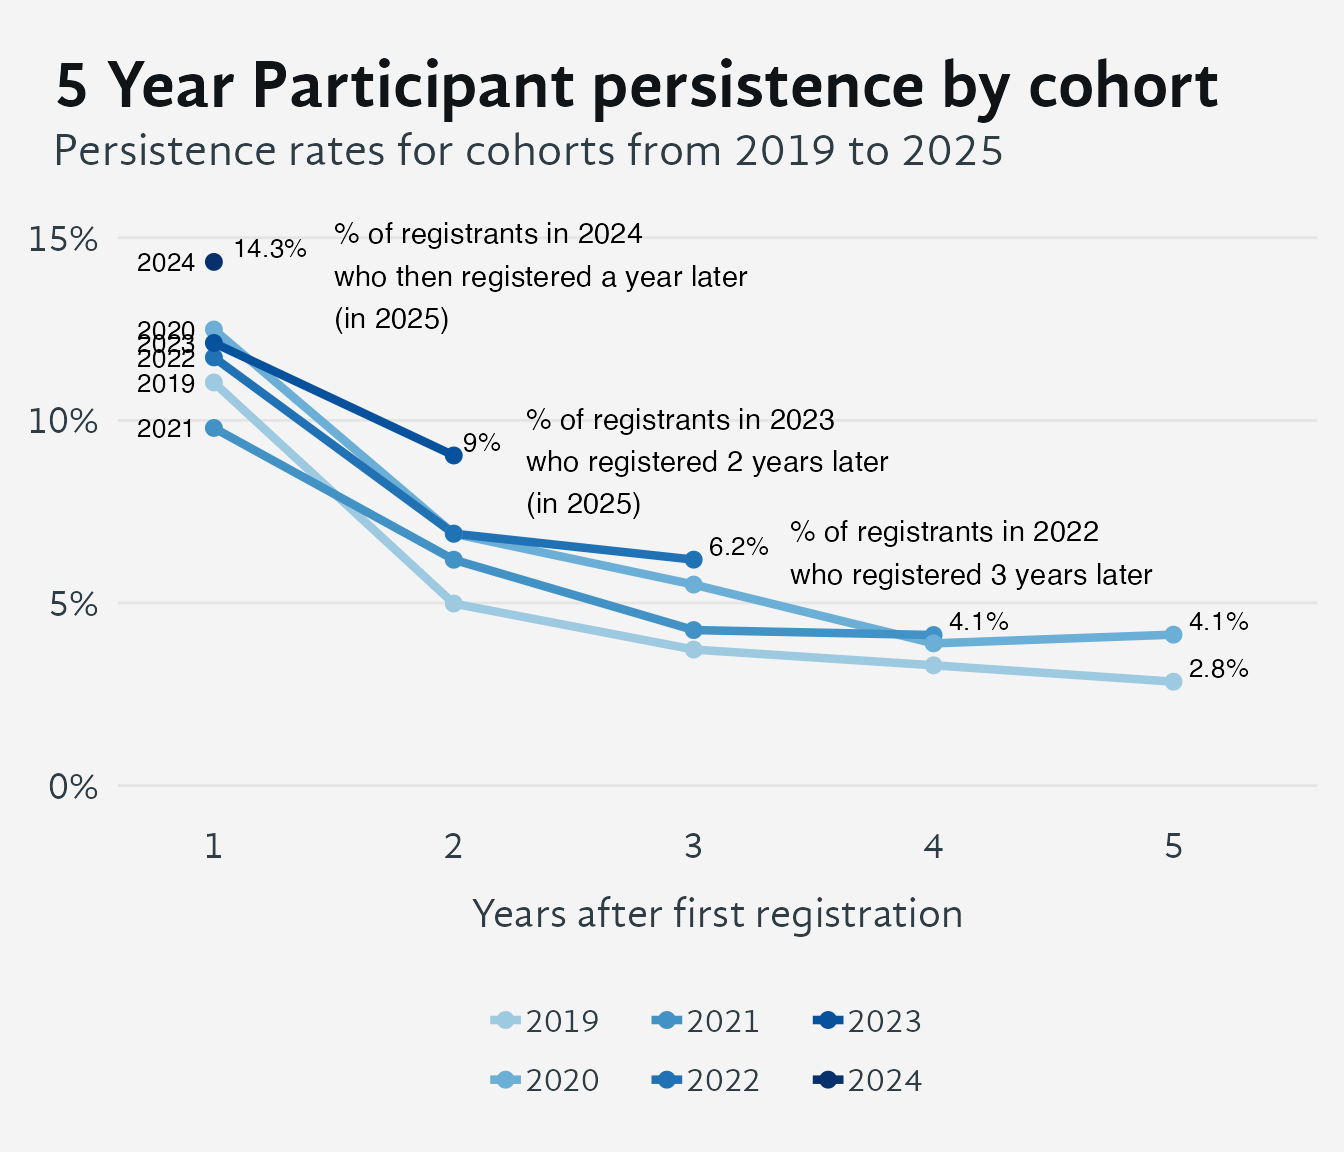
Across all entry cohorts, roughly 10 to 15 percent of first-time registrants return to register in a subsequent year. The 2024 cohort’s 14.3% one-year return rate means that of the nearly 4,000 people who registered for the first time in 2024, about 560 came back to register again in 2025. Return rates decline further with each additional year since first registration.

Participants who registered for three or more programs in their first year show substantially higher persistence rates in every subsequent year than those who attended only one. First-year engagement is a strong predictor of whether someone continues to participate in Shambhala programming.
6 Impact of first program type
Using “gate” to classify programs over a seven-year period to show the overall effect of the first program registration for people who first participated since 2018.

The first program someone takes shapes whether they continue registering. Introductory programs account for a larger share of one-time participants, while those who go on to take multiple programs are more likely to have started with Heart of Warriorship or Sacred Path offerings.
| Persistence by Gate of First Program | |||
| Gate of First Program |
Participation Pattern
|
Difference | |
|---|---|---|---|
| One program only | Many programs | ||
| Shambhala Path | 13.8% | 23.7% | 9.9% |
| Introduction | 23.7% | 17.6% | −6.2% |
| Wellness, Life, Arts | 15.3% | 16.2% | 0.9% |
| Other | 15.1% | 14.4% | −0.7% |
| Practice | 16.7% | 13.1% | −3.7% |
| Buddhism | 11.6% | 12.2% | 0.6% |
7 Registration by (Rough) Program Category

Looking at all program categories together makes the relative volume of each track visible alongside the 2020 disruption that affected them all. Some categories have recovered closer to their pre-2020 levels than others, and the relative ranking of program types by registration volume has shifted across the period.

The three core Shambhala curriculum tracks — Heart of Warriorship, Sacred Path, and Basic Goodness and Everyday Life — follow broadly similar patterns over the decade, but with differences in how much each recovered after 2020. Examining them together highlights which tracks have maintained stronger participation.
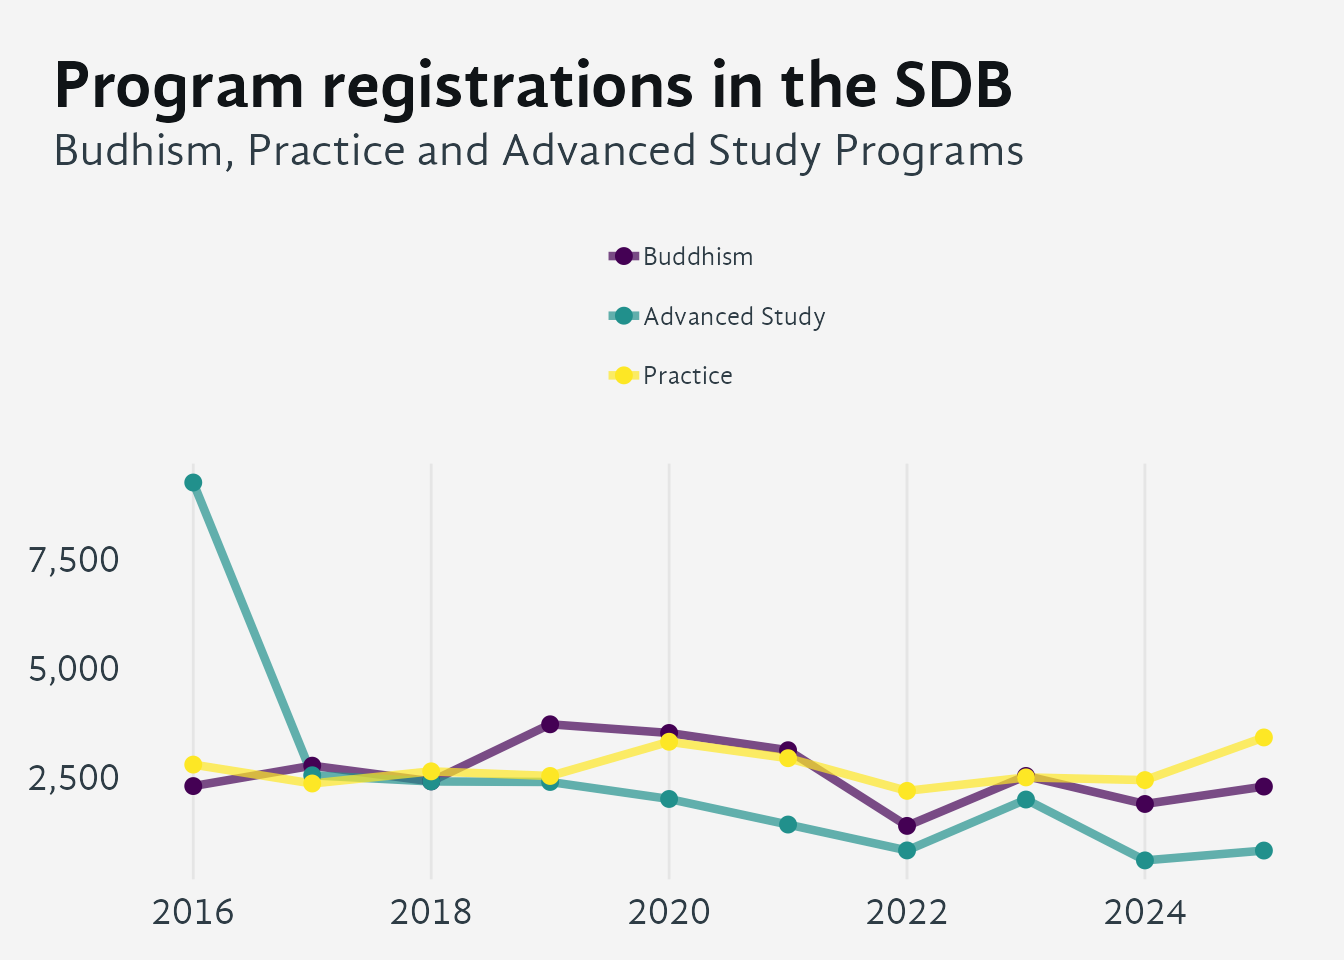
Buddhism, Practice, and Advanced Study programs serve participants who are deepening their involvement beyond the introductory curriculum. Registration counts for these tracks show how sustained that deeper engagement has been over the decade, and whether any one track has pulled ahead of the others.
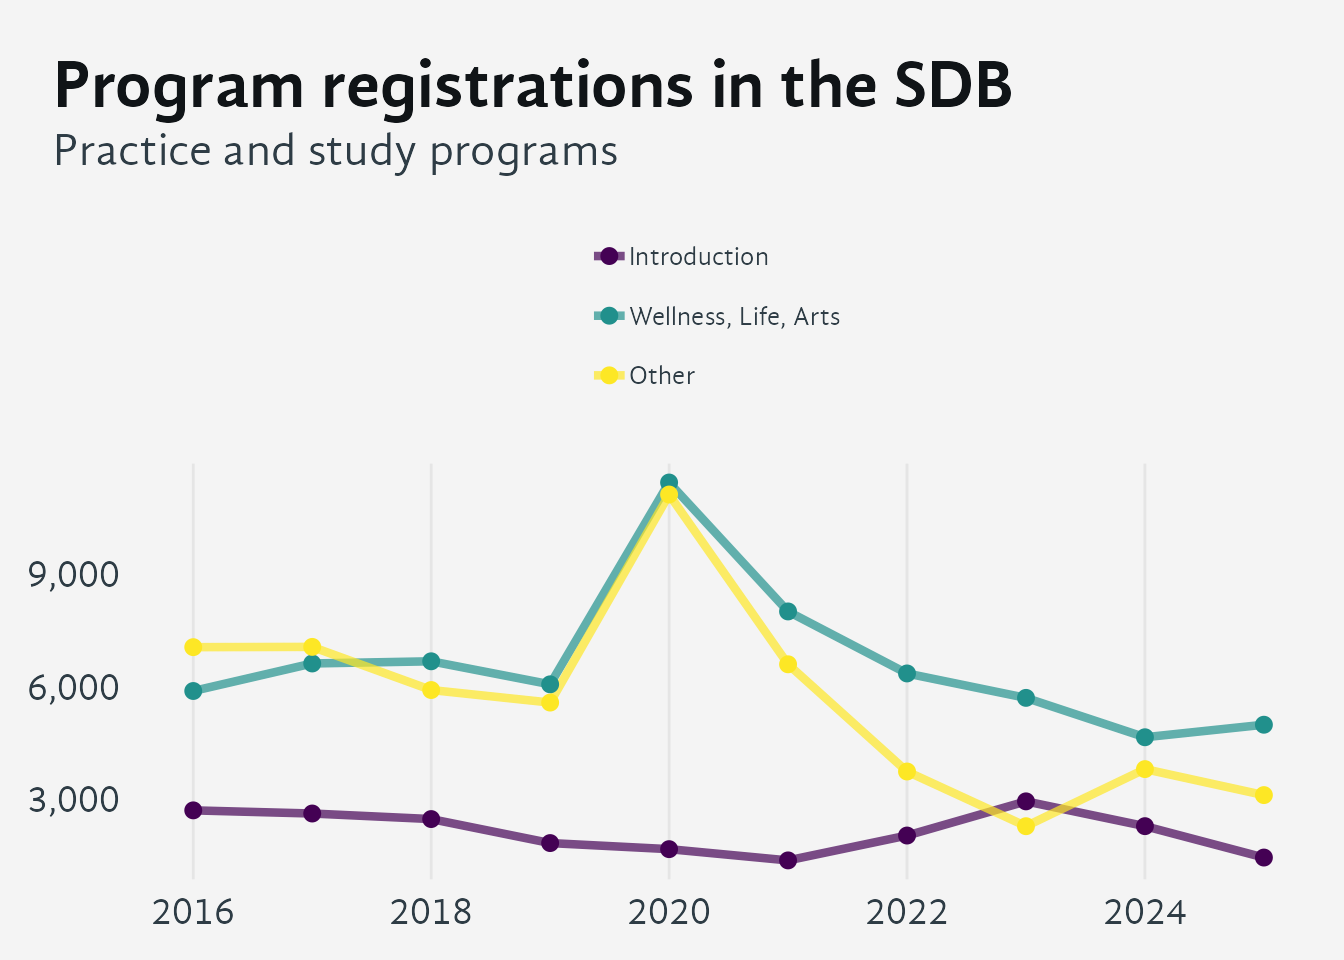
Introduction programs, wellness and life arts offerings, and miscellaneous programming all serve people at the edges of the core Shambhala curriculum. Registration trends in these categories reflect both how the community attracts newcomers and how broadly accessible programming has evolved over the decade.
(Click on a dot to see a count, click on the legend to hide a category)
| Program Registrations in the SDB | ||||||||||
| Category | 2016 | 2017 | 2018 | 2019 | 2020 | 2021 | 2022 | 2023 | 2024 | 2025 |
|---|---|---|---|---|---|---|---|---|---|---|
| Introduction | 2,698 | 2,614 | 2,466 | 1,826 | 1,664 | 1,364 | 2,027 | 2,938 | 2,277 | 1,440 |
| Heart of Warriorship | 6,470 | 6,463 | 5,502 | 2,701 | 1,403 | 1,351 | 912 | 1,011 | 1,527 | 1,742 |
| Sacred Path | 3,017 | 3,264 | 1,986 | 925 | 858 | 433 | 881 | 1,020 | 507 | 977 |
| Buddhism | 2,287 | 2,755 | 2,395 | 3,705 | 3,506 | 3,110 | 1,373 | 2,519 | 1,876 | 2,276 |
| Advanced Study | 9,254 | 2,535 | 2,393 | 2,381 | 1,991 | 1,404 | 810 | 1,978 | 581 | 807 |
| Practice | 2,780 | 2,346 | 2,625 | 2,519 | 3,304 | 2,927 | 2,177 | 2,486 | 2,424 | 3,403 |
| Basic Goodness & Everyday Life | 5,621 | 5,303 | 4,409 | 1,822 | 1,194 | 1,225 | 709 | 577 | 267 | 289 |
| Wellness, Life, Arts | 5,880 | 6,614 | 6,672 | 6,058 | 11,438 | 8,001 | 6,348 | 5,697 | 4,647 | 4,981 |
| Other | 7,049 | 7,056 | 5,906 | 5,572 | 11,118 | 6,592 | 3,734 | 2,276 | 3,798 | 3,105 |
A total of 1,353 program offerings were listed in the Shambhala Database in 2025 — a decline of 53% since 2016. Shambhala Path offerings specifically declined 34% over the same period, while registrations for Path programs fell 71%.
8 Program offerings: numbers and length
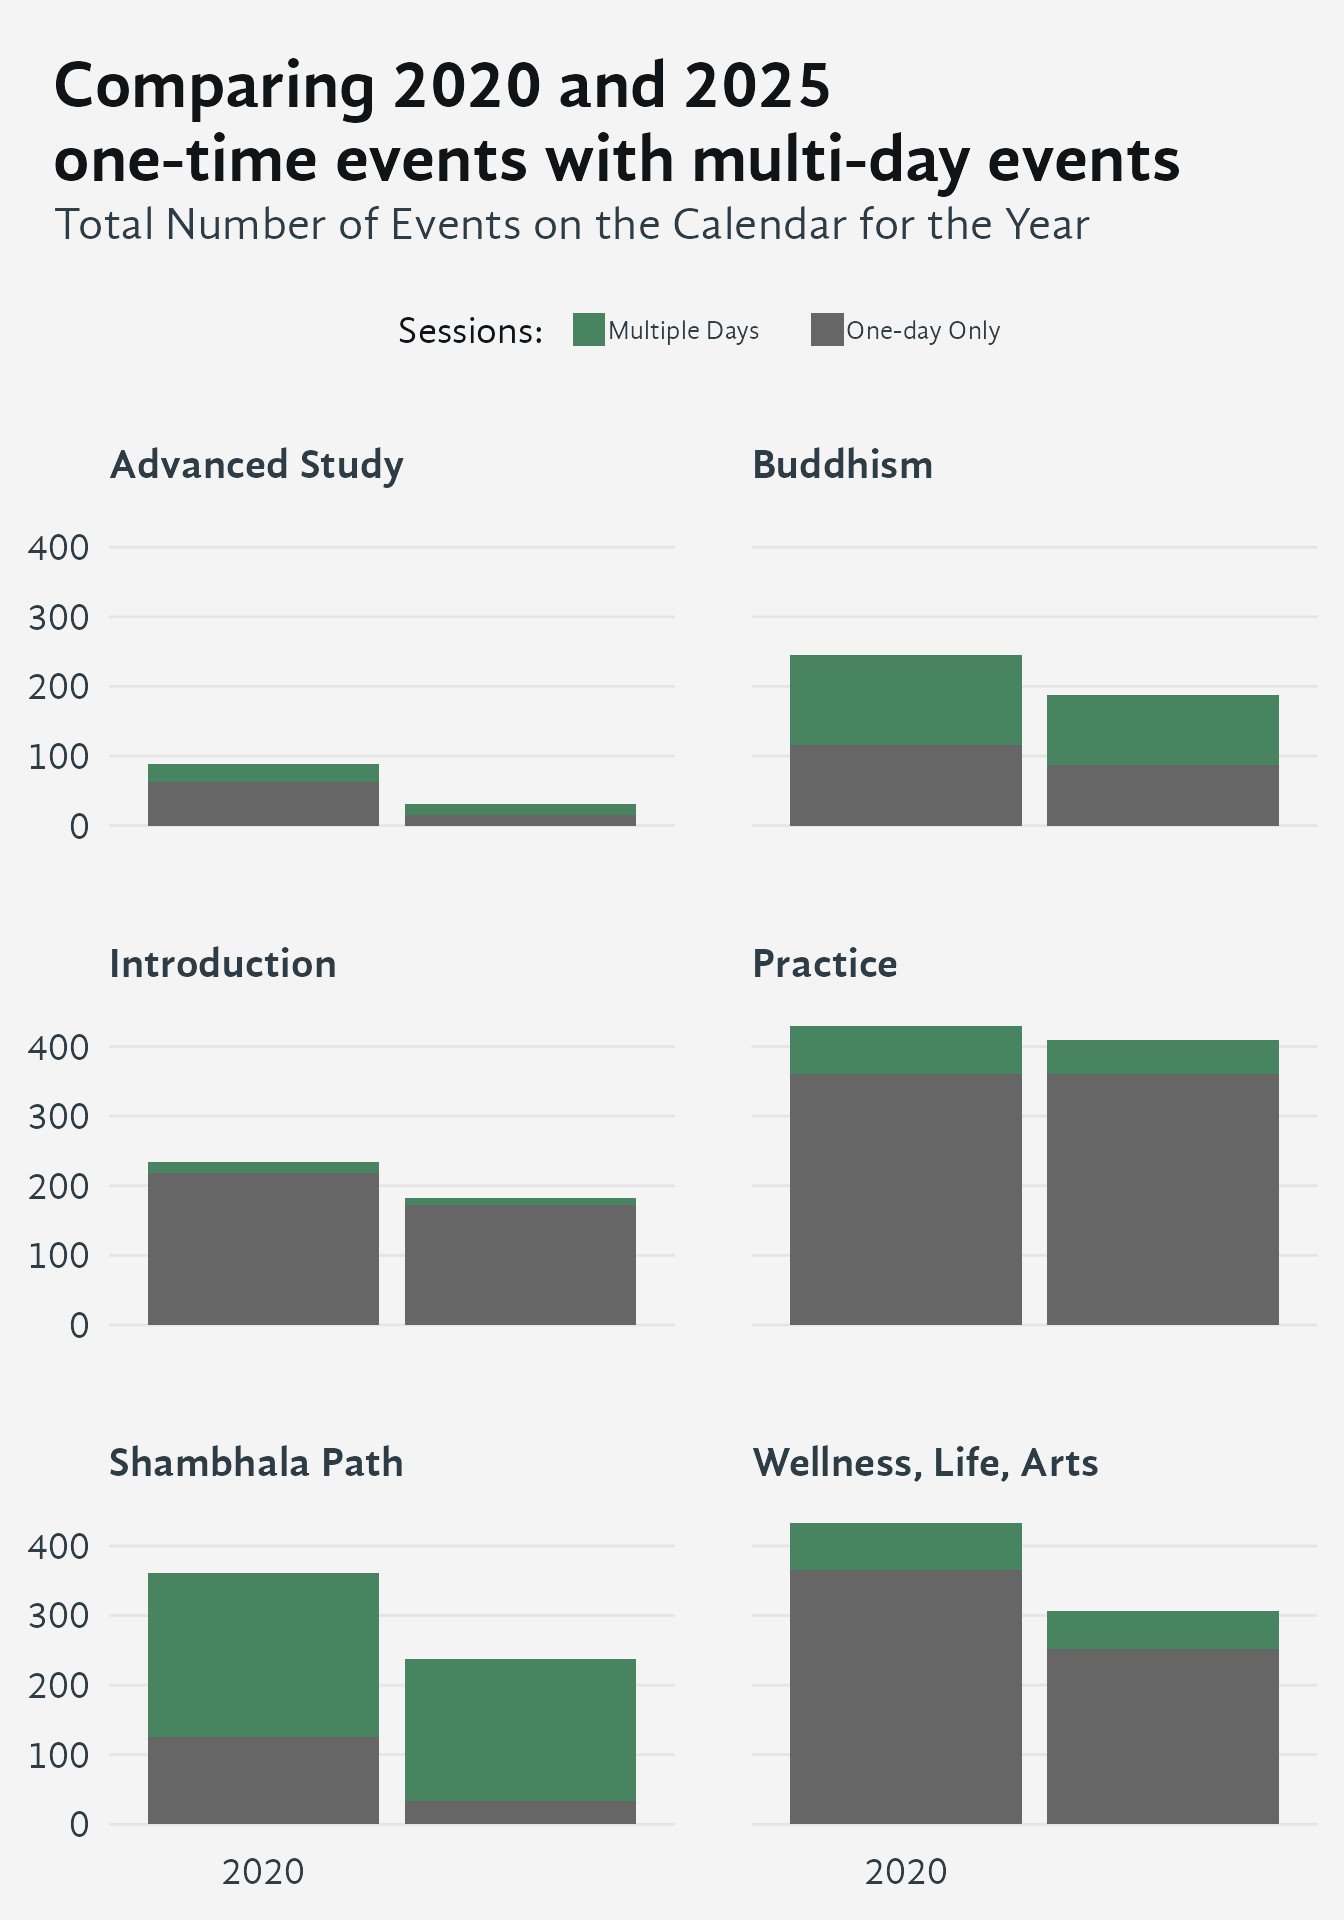
Comparing 2020 and 2025 across program types shows that total calendar volume declined in some tracks while holding or growing in others. In several categories, single-day events now account for a larger share of total offerings than in 2020 — a shift toward shorter formats that may reflect practical constraints on both organizers and participants.
Tip
Note that you can sort this table by clicking on the header
| Comparing programs between 2020 and 2025 | ||||||
| Yellow indicates more one-day programs | ||||||
| Program Type | % 2025 |
Programs Offered
|
% Single Day
|
|||
|---|---|---|---|---|---|---|
| 2020 | 2025 | % in 2020 | % in 2025 | |||
| Practice | 30.2% | 429 | 409 | 84.1% | 88.0% | 3.9% |
| Wellness, Life, Arts | 22.7% | 433 | 307 | 84.5% | 82.1% | −2.4% |
| Shambhala Path | 17.5% | 361 | 237 | 34.9% | 14.3% | −20.6% |
| Buddhism | 13.8% | 245 | 187 | 47.3% | 46.5% | −0.8% |
| Introduction | 13.5% | 234 | 182 | 93.6% | 94.5% | 0.9% |
| Advanced Study | 2.3% | 89 | 31 | 70.8% | 48.4% | −22.4% |
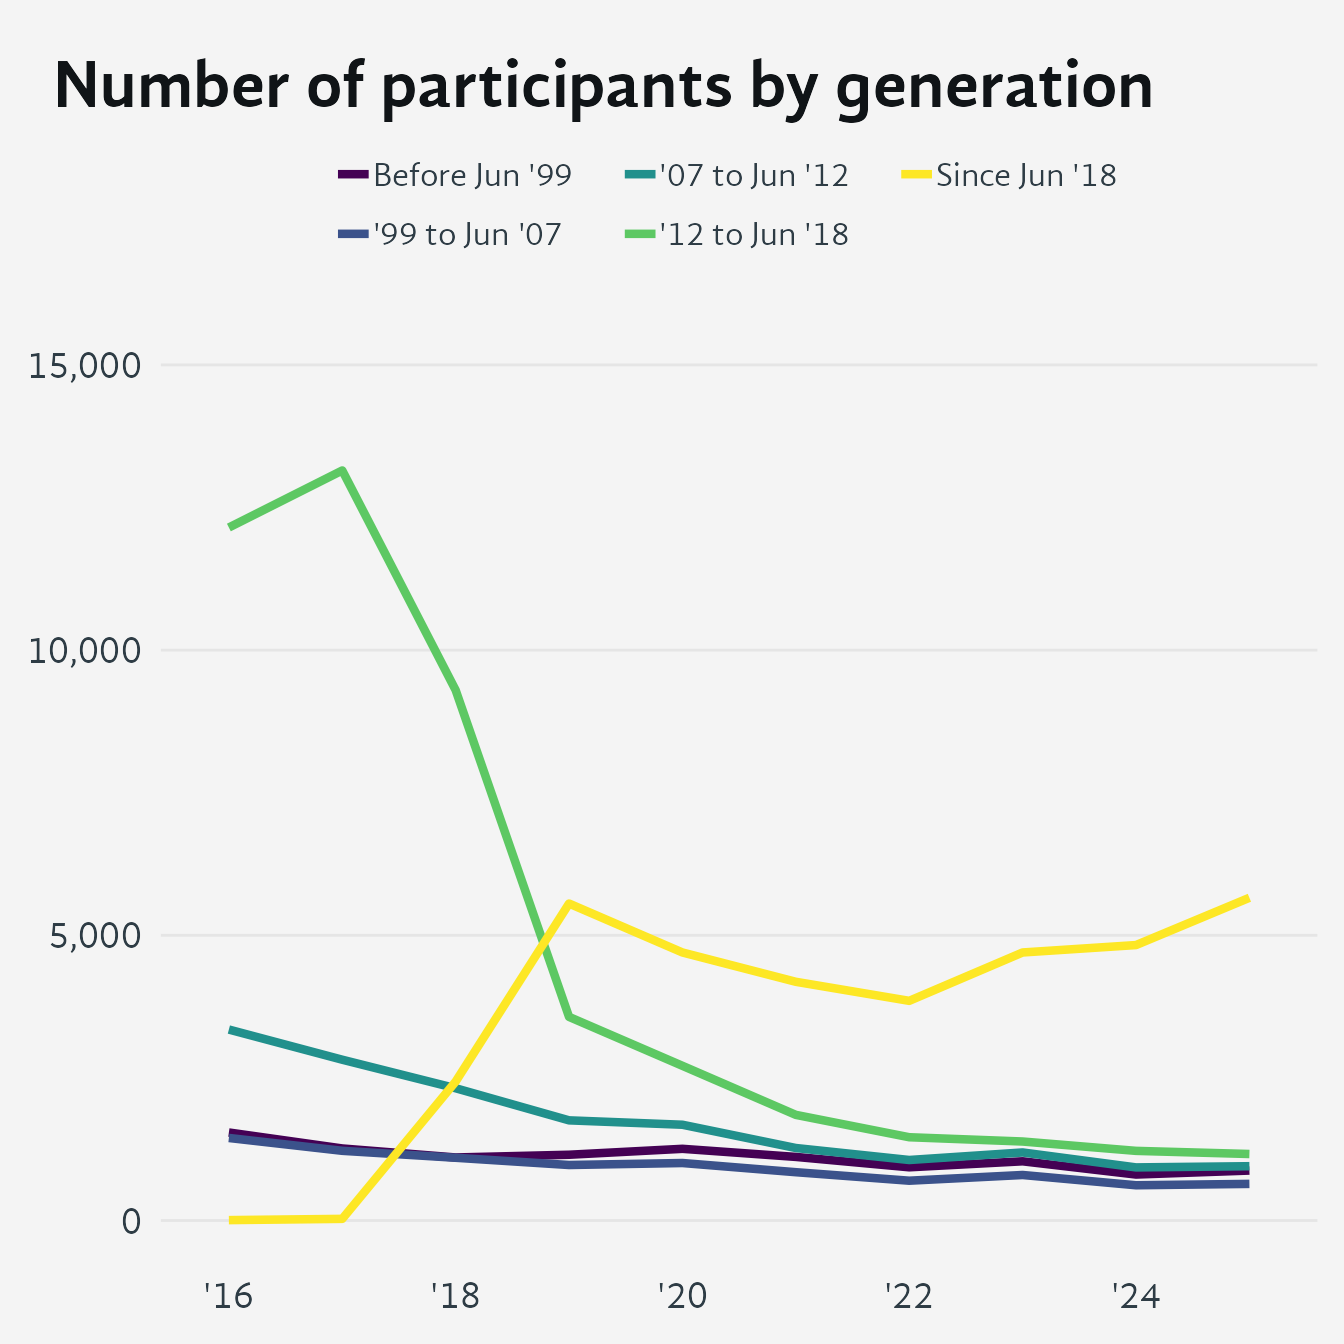
In producing enrollment statistics from the SDB, we grouped members and friends of Shambhala into five cohorts based on the date of their estimated first contact with Shambhala. These time periods correspond to those self-reported in the survey.
9 Enrollment by date of first contact
| Number of registering participants by generation | |||||||||||
| When Connected | '16 | '17 | '18 | '19 | '20 | '21 | '22 | '23 | '24 | '25 | |
|---|---|---|---|---|---|---|---|---|---|---|---|
| Before Jun '99 | 5,750 | 3,334 | 3,044 | 3,593 | 7,232 | 5,505 | 3,627 | 3,519 | 2,506 | 2,590 | |
| '99 to Jun '07 | 5,331 | 3,498 | 3,097 | 3,057 | 5,552 | 3,865 | 2,656 | 2,671 | 2,040 | 2,008 | |
| '07 to Jun '12 | 10,589 | 7,485 | 6,085 | 4,789 | 7,151 | 4,528 | 3,098 | 3,360 | 2,445 | 2,429 | |
| '12 to Jun '18 | 22,788 | 24,226 | 18,909 | 8,331 | 8,557 | 5,271 | 3,551 | 3,475 | 2,956 | 2,918 | |
| Since Jun '18 | 15 | 34 | 2,870 | 7,418 | 7,473 | 6,970 | 5,879 | 7,371 | 7,903 | 8,975 | |
| Total | — | 44,473 | 38,577 | 34,005 | 27,188 | 35,965 | 26,139 | 18,811 | 20,396 | 17,850 | 18,920 |
The sharpest enrollment declines over the past decade have been among those who first connected with Shambhala between 2007 and 2018. Earlier cohorts have held their participation levels more steadily, while the post-2018 cohort — the newest generation of participants — has declined roughly 10 percent from its peak in 2020.