How Connected Do They Feel

For the past few years, the Societal Mirror Member and Friends survey has asked respondents to rate their sense of belonging or connection to the Shambhala community on a scale of 0 to 10.
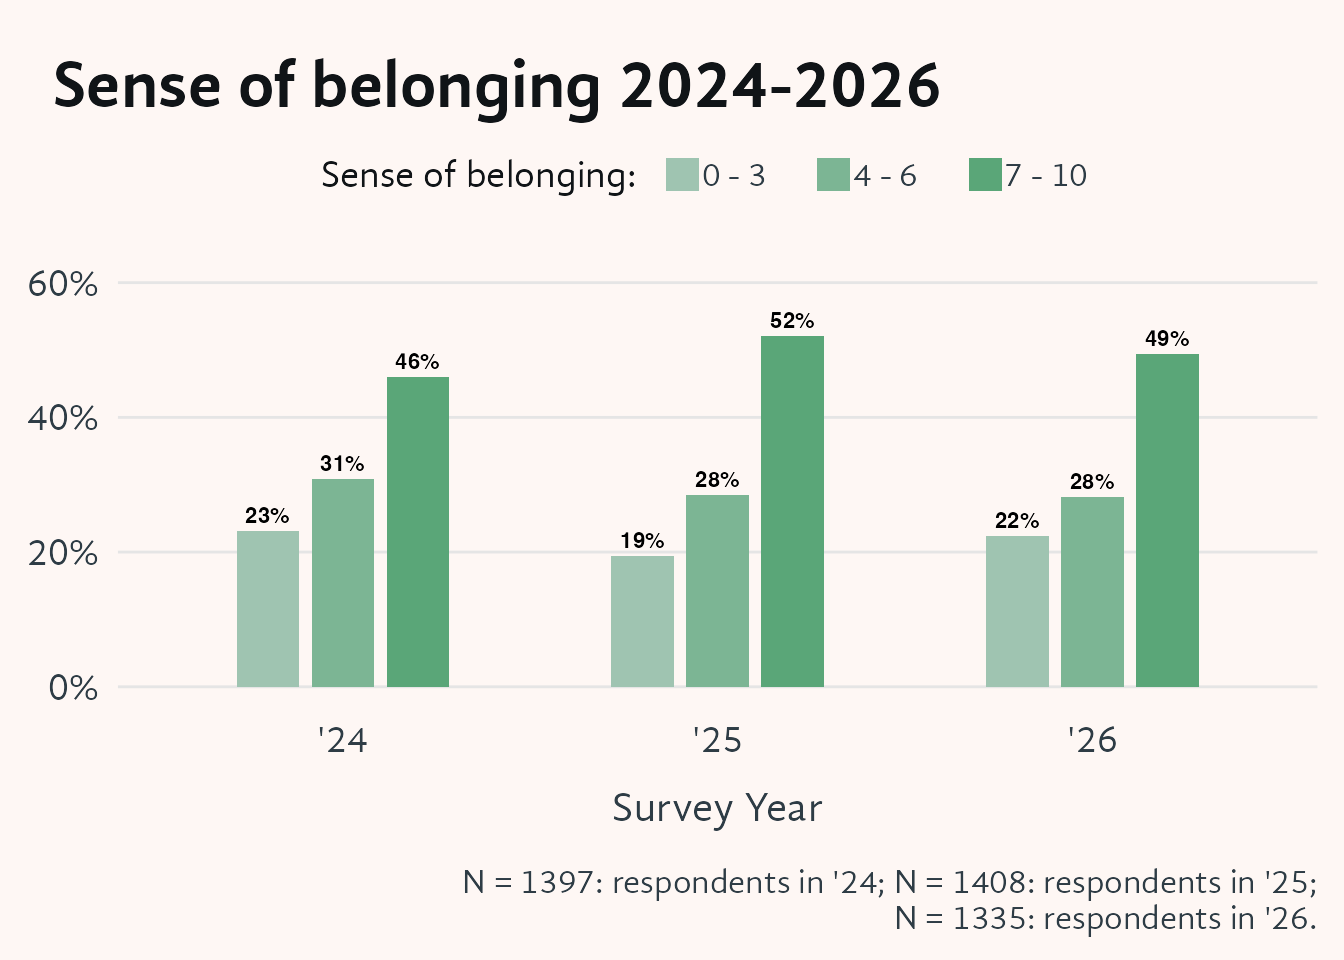
1 Sense of belonging comparison: 2023 to 2025

Grouped bar chart comparing sense of belonging across three survey years (2024, 2025, 2026) on the x-axis and percentage of respondents on the y-axis. Three shades of green represent belonging tiers: 0–3 (low), 4–6 (moderate), and 7–10 (strong). In 2026, roughly half of respondents fall in the strong-belonging tier (7–10), matching 2024 but lower than 2025. The low-belonging tier (0–3) is larger in 2026 than in either prior year.
Figure 1

Half of 2026 respondents rate their sense of belonging as strong (7 or above on a 0–10 scale), matching the 2024 level but lower than 2025. The share reporting very low belonging (0–3) grew in 2026 compared to either of the previous two years.

2 Sense of belonging by year started in Shambhala

Grouped bar chart showing sense of belonging by the era a respondent first became involved in Shambhala. Four cohort groups appear on the x-axis (70s–80s, 90s–2007, 2008–2017, and 2018 onward); the y-axis shows the percentage of respondents in each belonging tier (0–3, 4–6, 7–10), encoded by three shades of green. More recent joiners show a markedly higher share rating their belonging as strong (7–10), while those who joined between 1990 and 2007 have the lowest strong-belonging rates and the highest low-belonging rates of any cohort.
Figure 2

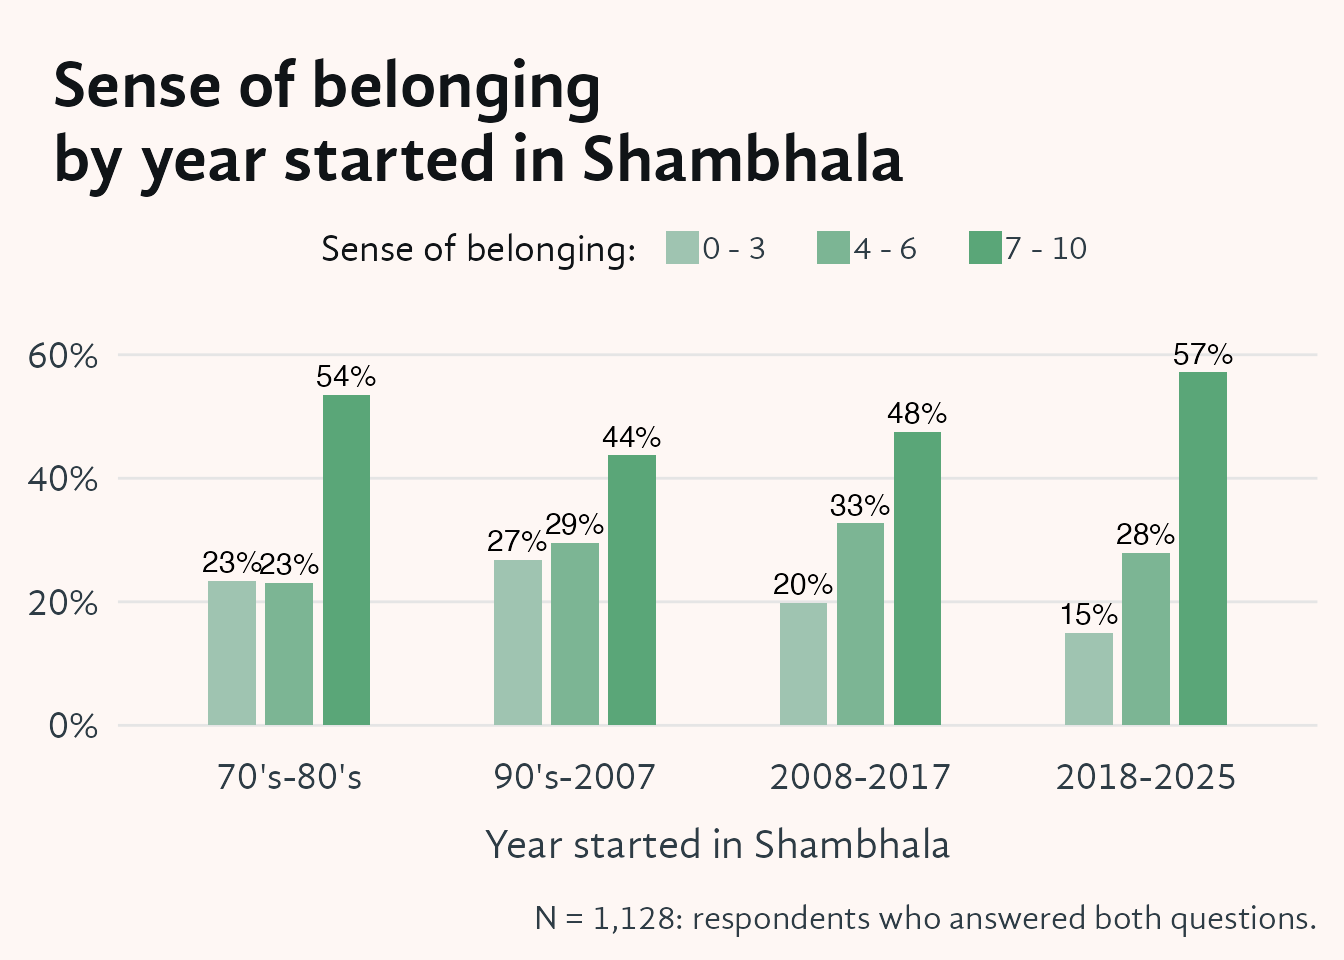
Those who joined Shambhala more recently report a stronger sense of belonging than those who entered in earlier decades. The 1990–2007 cohort has the lowest share of strong-belonging ratings and the highest share of low-belonging ratings among all four cohorts.

3 Likely to recommend Shambhala by whether they relate to a centre

Grouped bar chart showing recommender scores by whether a respondent relates to a Shambhala centre. The x-axis has three groups (Yes, No, Not sure); the y-axis shows the percentage of respondents. Four shades of green encode recommender score tiers: 0–3 (low), 4–6, 7–8, and 9–10 (high). Respondents who relate to a centre have a substantially higher share of top recommender scores (9–10) than those who do not relate to a centre or are unsure.
Figure 3

Those who relate to a Shambhala centre give substantially more high recommender scores than those who do not relate to a centre or are unsure of their connection. Among respondents without a centre connection, recommender scores are quite a bit lower.

4 Sense of belonging by whether they relate to a center

Grouped bar chart showing sense of belonging by whether respondents relate to a Shambhala centre. The x-axis has three groups (Yes, No, Not sure); the y-axis shows the percentage of respondents. Three shades of green encode belonging tiers: 0–3 (low), 4–6 (moderate), and 7–10 (strong). Respondents who relate to a centre have a substantially larger share rating their belonging as strong (7–10). Those who definitely do not relate to a centre report the weakest belonging overall, lower even than those who are unsure of their connection.
Figure 4

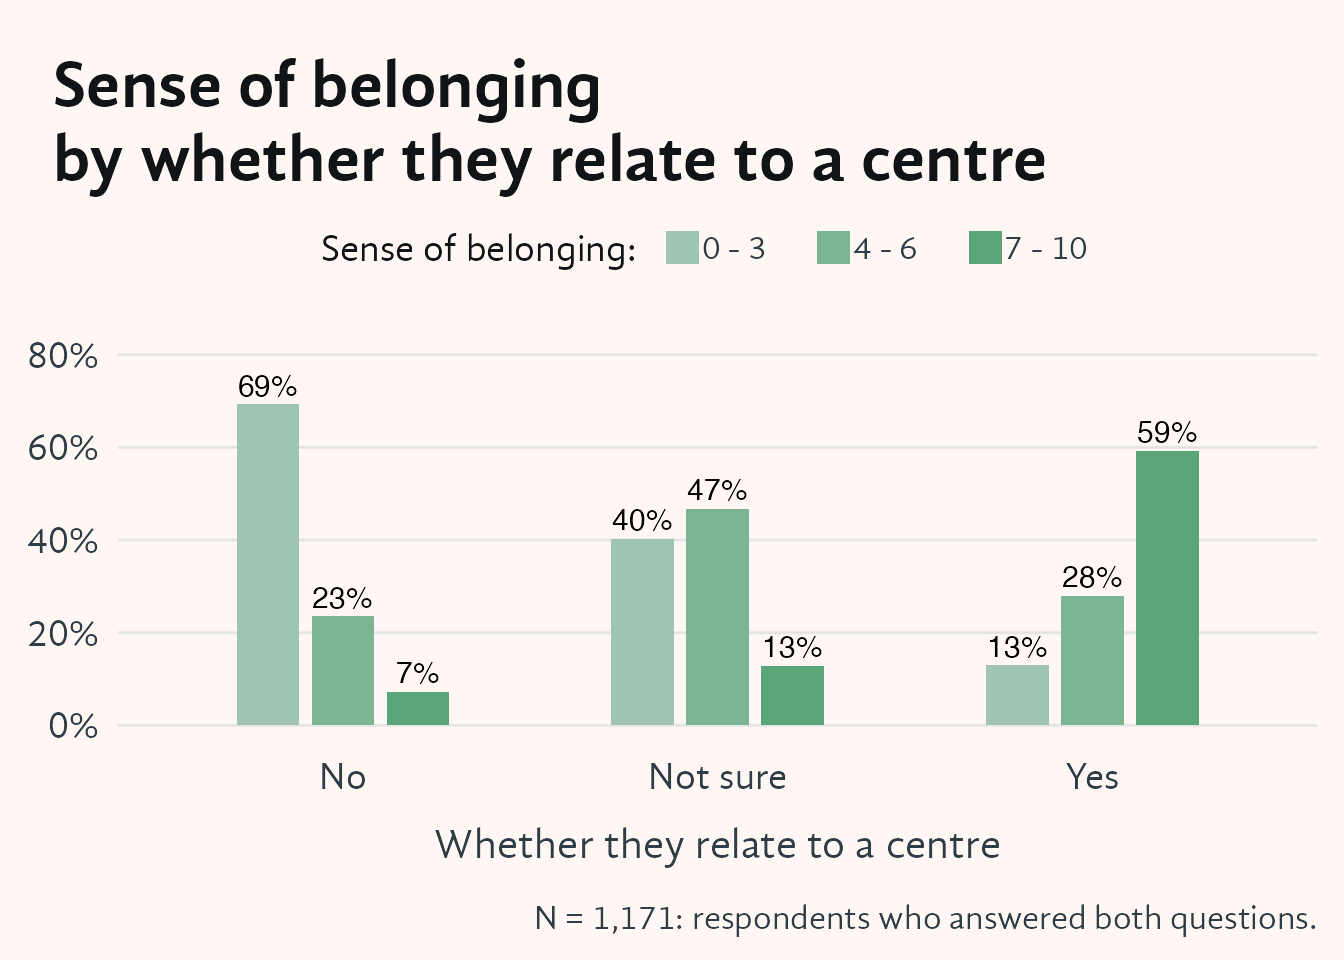
People affiliated with a Shambhala centre or group report a much stronger sense of belonging than those who are unaffiliated or unsure. Among the latter, those who are completely unaffiliated feel the least sense of belonging.