How Engaged Are They

1 Participation in specific activities

Horizontal bar chart showing the percentage of 1,335 survey respondents who participated in each of seven Shambhala activities in the past 12 months. Activities appear on the y-axis sorted from highest to lowest participation, with percentage on the x-axis. Group meditation ranks highest at roughly 80%, followed by financial donations or dues payment, study at a local group or centre, and volunteering. Participation in residential programs originating from a centre and Shambhala Online study are the least common, each reported by fewer than a quarter of respondents.
Figure 1

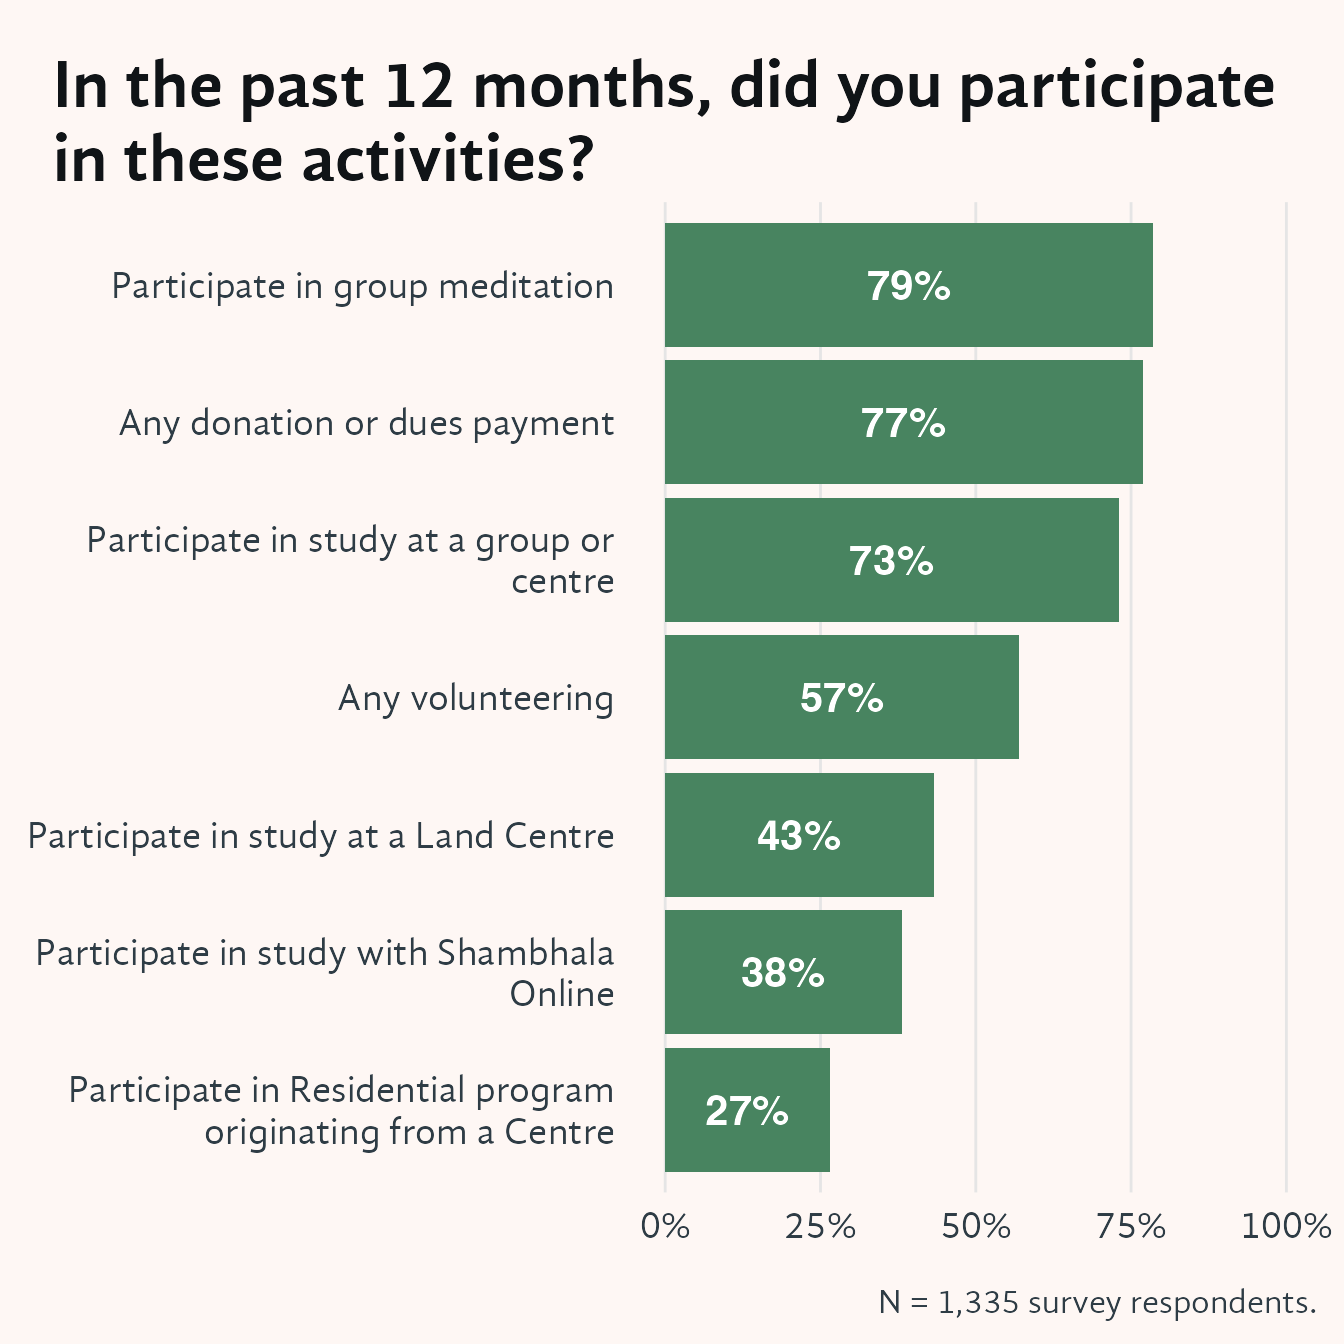
Around three quarters of respondents have engaged in group study or group meditation and supported their centre or Shambhala with a donation or dues. Between a quarter and a half have taken the step to engage in more immersed study or practice at a residential event. Among survey respondents in the past year: 79% participated in group meditation in Shambhala, including 67% in an in-person setting; 77% gave financial support; 73% engaged in formal study; 57% volunteered; and 38% participated in a Shambhala Online program.

2 Participation across the generations

Grouped bar chart showing participation rates in four Shambhala activities — group meditation, any donation or dues payment, study at a group or centre, and any volunteering — on the x-axis, with percentage of respondents on the y-axis. Bars within each activity are grouped by the four entry cohorts (70s–80s through 2018–2025), shown in distinct colors. The mix of participation is broadly similar across cohorts. The most recent entrants (2018–2025) report the highest engagement in most activities, suggesting that newer members are currently the most actively involved.
Figure 2

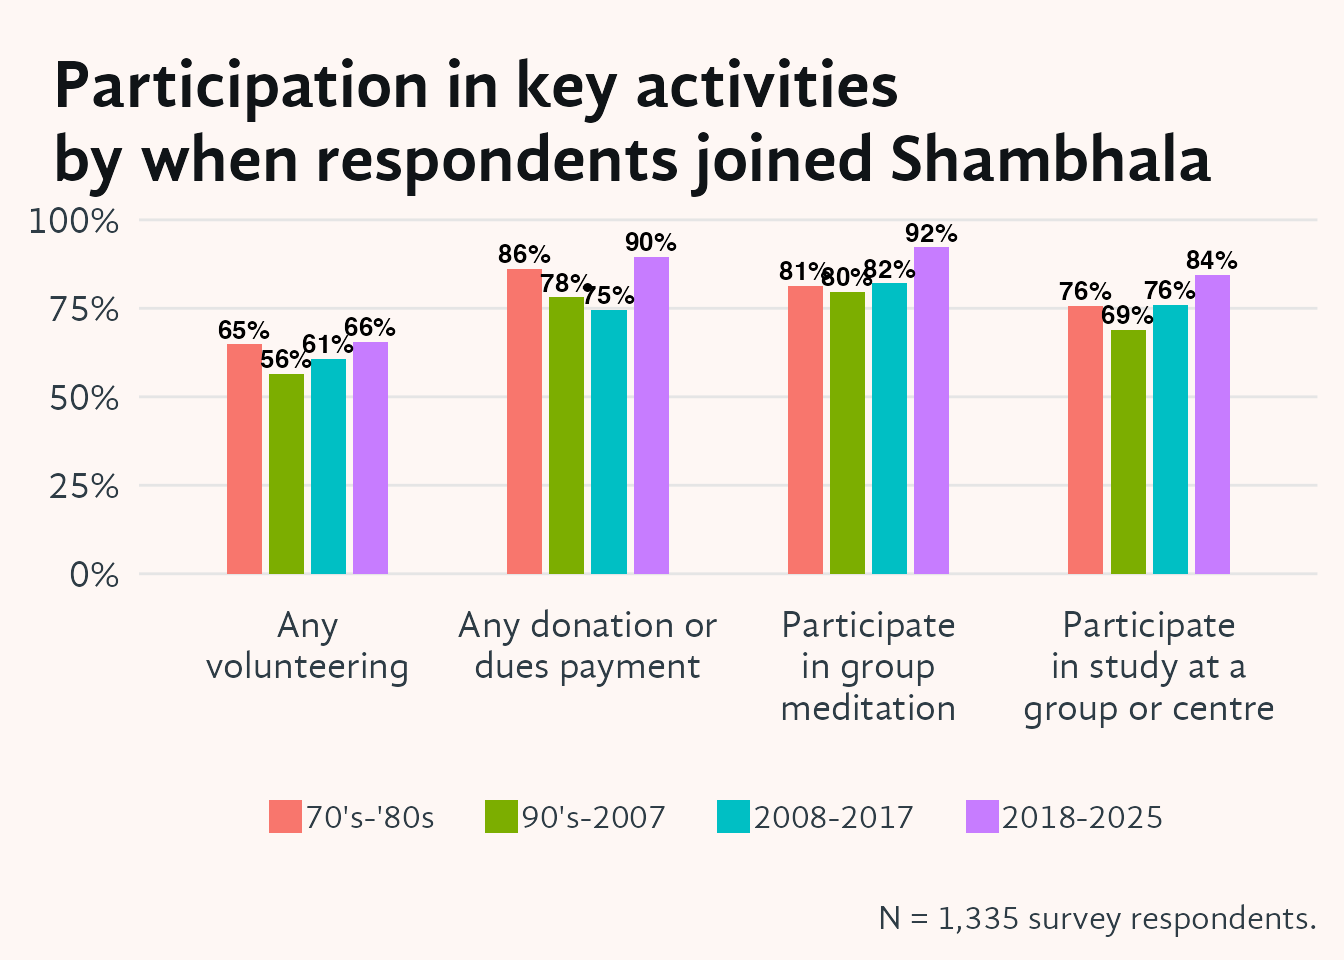
Of the four generations in Shambhala, those who have been engaged for the longest time, and the shortest time show slightly higher levels of participation than those who joined 1990-2007, and in the case of most recent entrants this is quite marked.

3 Study activities across the generations

Grouped bar chart showing participation rates in three study activity types — study at a land or retreat centre, study with Shambhala Online, and residential programs originating at a centre — on the x-axis, with percentage of 1,335 respondents on the y-axis. Bars within each activity are grouped by the four entry cohorts (70s–80s through 2018–2025). In all three categories the 1990–2007 cohort participates least. Shambhala Online is the exception to the general pattern: it is used most by the longest- tenured members (70s–80s) rather than the newest, suggesting that online formats serve as a way for geographically dispersed older members to stay engaged.
Figure 3

In all categories of study, those who have been with Shambhala the longest, report the highest levels of participation in study – except in participation at a land centre, where the most recent members participate slightly more. The cohort participating least in study activities is those who joined from 1990 to 2007.

4 Participation by study location

Grouped bar chart showing four program types — Buddhist study or practice, Shambhala study or practice, other meditation topics, and arts or cultural activities — at four study locations (local group or centre, land or retreat centre, residential retreat, and Shambhala Online) on the x-axis, expressed as a percentage of all 1,335 respondents on the y-axis. Bars within each location are grouped by program type using distinct colors. Local groups or centres dominate all four program types: they account for substantially more Buddhist study, Shambhala study, meditation-adjacent topics, and arts or cultural activities than any other location, reflecting the greater frequency, lower cost, and accessibility of programming there.
Figure 4

By far the most Buddhist and Shambhala study and practice occurs in a local centre/group setting, and also the most programs on other topics related to meditation, and in arts, cultural or social activities occur there. The difference between levels of participation across the four locations likely reflects the degree of ready availability or accessibility (in terms of frequency, cost or time commitment) of study opportunities in each location.
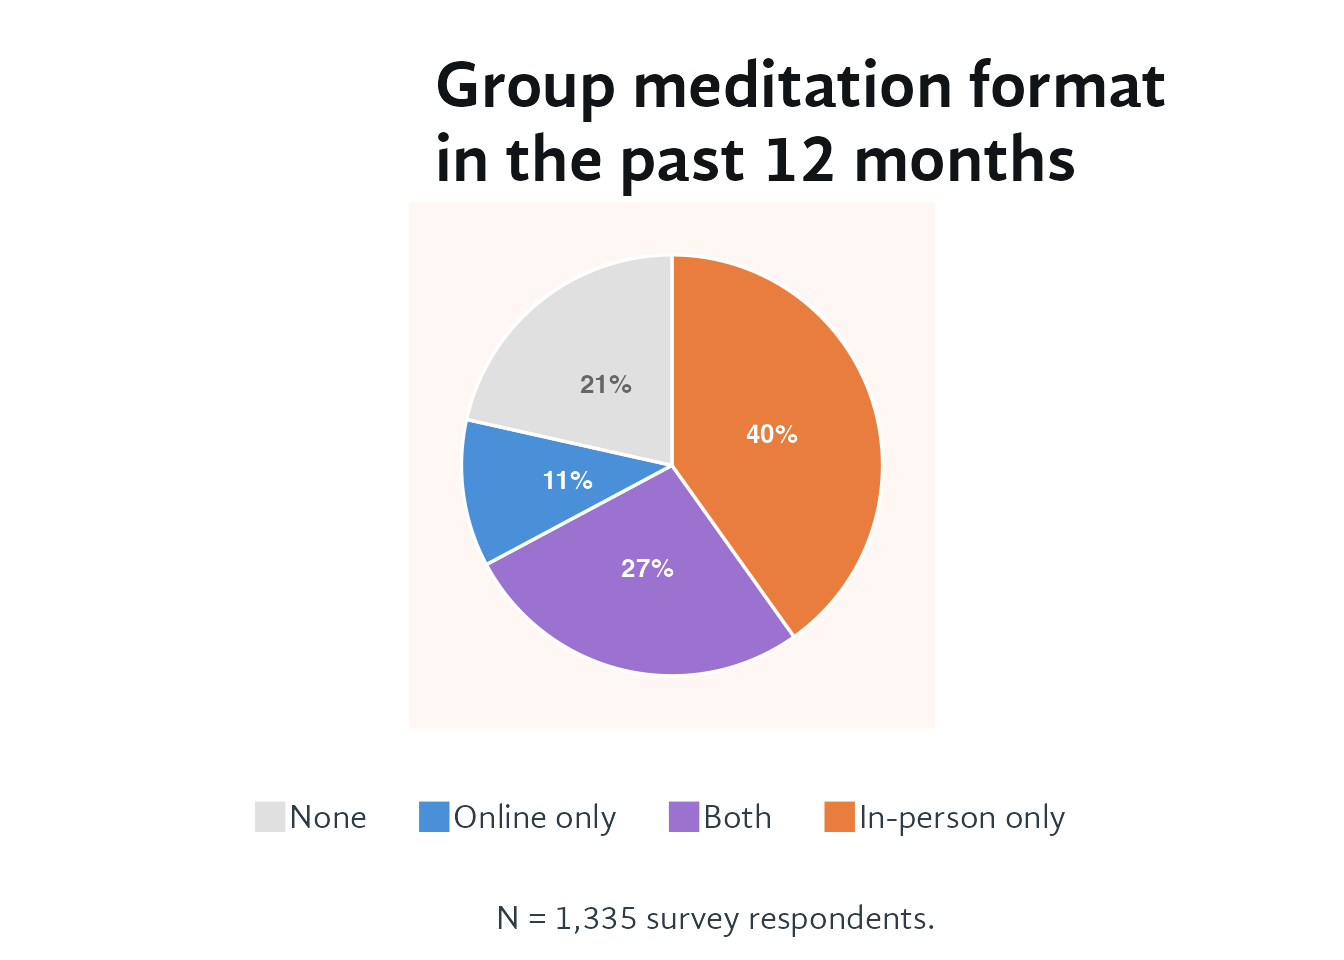
Pie chart showing the group meditation format used by 1,335 survey respondents in the past 12 months. Four slices represent None (light grey), Online only (blue), Both online and in-person (purple), and In-person only (warm orange). In-person only is the largest slice, with Both the second largest. Together they account for roughly two-thirds of respondents. Nearly 80% participated in some form of group meditation, underscoring it as the most common Shambhala activity.
Figure 5

Nearly 80% of respondents participated in group meditation practice in the previous 12 months, and of these, three quarters engaged in person. However, quite a high proportion (42%) of those who did group meditation did so online.

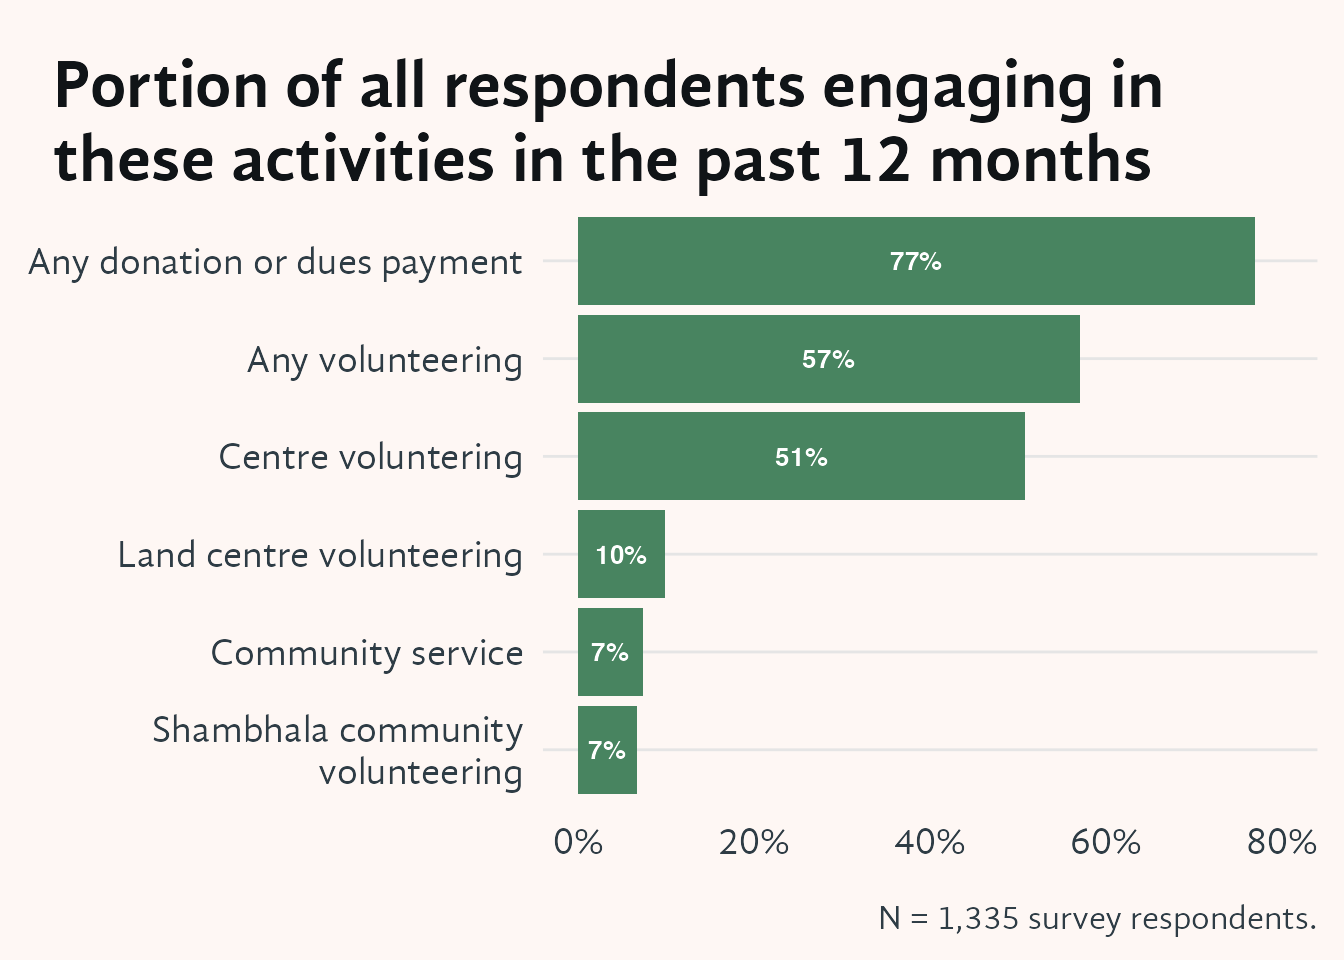
More than three-quarters of respondents reported that they had made some financial donation to Shambhala in the previous 12 months, while more than half said they had volunteered, primarily in local groups and centres.