Membership (from administrative records)

1 Trends in Members and Friends counts
Members
|
Friends
|
|||||||
|---|---|---|---|---|---|---|---|---|
| Year |
Year-end Count |
% |
Change from previous year
|
|||||
| Members | Friends | Total | Count | % | Count | % | ||
| 2020 | 7,991 | 2,001 | 9,992 | −4% | −608 | −8% | 247 | 12% |
| 2021 | 7,616 | 2,079 | 9,695 | −3% | −375 | −5% | 78 | 4% |
| 2022 | 7,351 | 2,216 | 9,567 | −1% | −265 | −4% | 137 | 6% |
| 2023 | 6,802 | 2,432 | 9,234 | −4% | −549 | −8% | 216 | 9% |
| 2024 | 6,620 | 2,578 | 9,198 | −0% | −182 | −3% | 146 | 6% |
| 2025 | 6,076 | 2,820 | 8,896 | −3% | −544 | −9% | 242 | 9% |

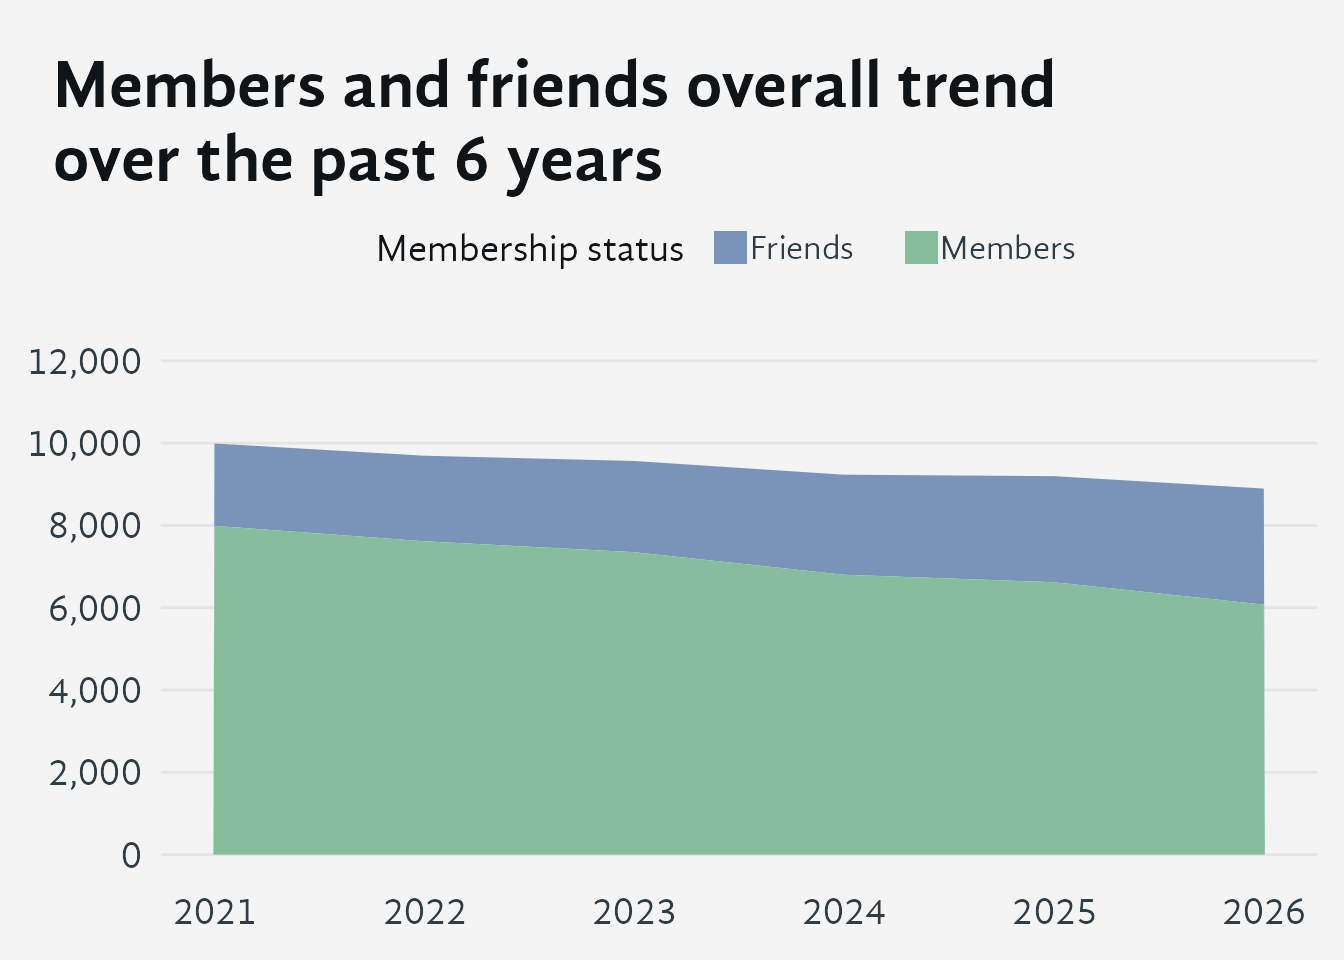
Shambhala membership grew steadily through the mid-2010s, reaching its historical peak in 2018. The rates of decline since then show a sharp drop in the period following the Shambhala crisis and a more steady, slowing rate of decline since then. The peak and the year it occurred are marked on the chart.
At the end of 2025, Shambhala had 8,896 combined members and friends — a 3% decrease from 2024 and 11% below the 2020 level. The number of formal members declined by 544 over the year, while the number of friends grew by 242. This indicates that there is a growing group of people who are loosening their connection to Shambhala but not severing it.
2 Today’s members by generation

| 2025 Shambhala Membership By generation using the estimate from the SDB |
|||
| When Connected with Shambhala |
Number of Members |
% of Total | |
|---|---|---|---|
| Before Jun '99 | 1,373 | 23% | |
| '99 to Jun '07 | 1,024 | 17% | |
| '07 to Jun '12 | 1,522 | 25% | |
| '12 to Jun '18 | 1,408 | 23% | |
| Since Jun '18 | 749 | 12% | |
| Total | — | 6,076 | 100% |
Most of the members still shown in the Shambhala Database (SDB) have shown an extremely long lasting commitment to Shambhala. Although earlier records are very incomplete, over 5,000 members have been with Shambhala for at least ten years, and far longer for the majority of these. See how member records were used to calculate generations.
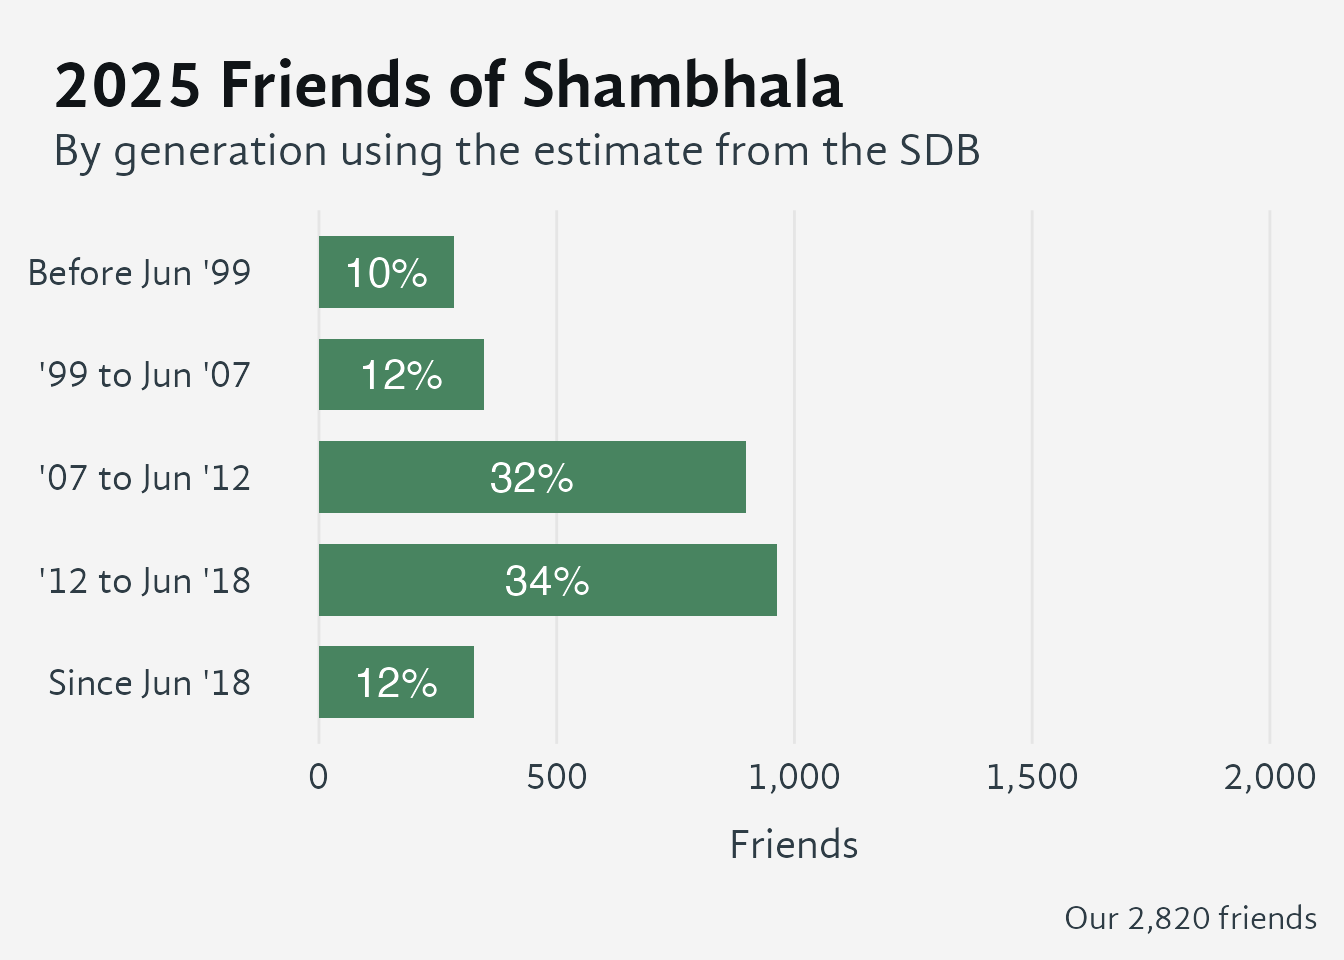
3 Today’s friends by generation
Centres designate people as “friends” to recognize involvement in center activities using a local definition of involvement.
| 2025 Shambhala Friends By generation using the estimate from the SDB |
|||
| When Connected with Shambhala |
Number of Friends |
% | |
|---|---|---|---|
| Before Jun '99 | 284 | 10% | |
| '99 to Jun '07 | 348 | 12% | |
| '07 to Jun '12 | 898 | 32% | |
| '12 to Jun '18 | 964 | 34% | |
| Since Jun '18 | 326 | 12% | |
| Total | — | 2,820 | 100% |
About 66% of current friends first connected with Shambhala during the period of rapid growth between 2008 and 2018. That concentration raises the question of whether a meaningful share of today’s Friends are former members who chose a lower level of affiliation rather than leaving entirely.
4 Where are members located?
Centres are densest in North America and Europe, with smaller clusters in South America and other regions. Circle size is proportional to the number of affiliated members; hovering over a location shows the centre name, member count, and recent enrollment activity.
5 Membership affiliation with centres and groups
This graph shows the number of members affiliated with centres and groups of different size.
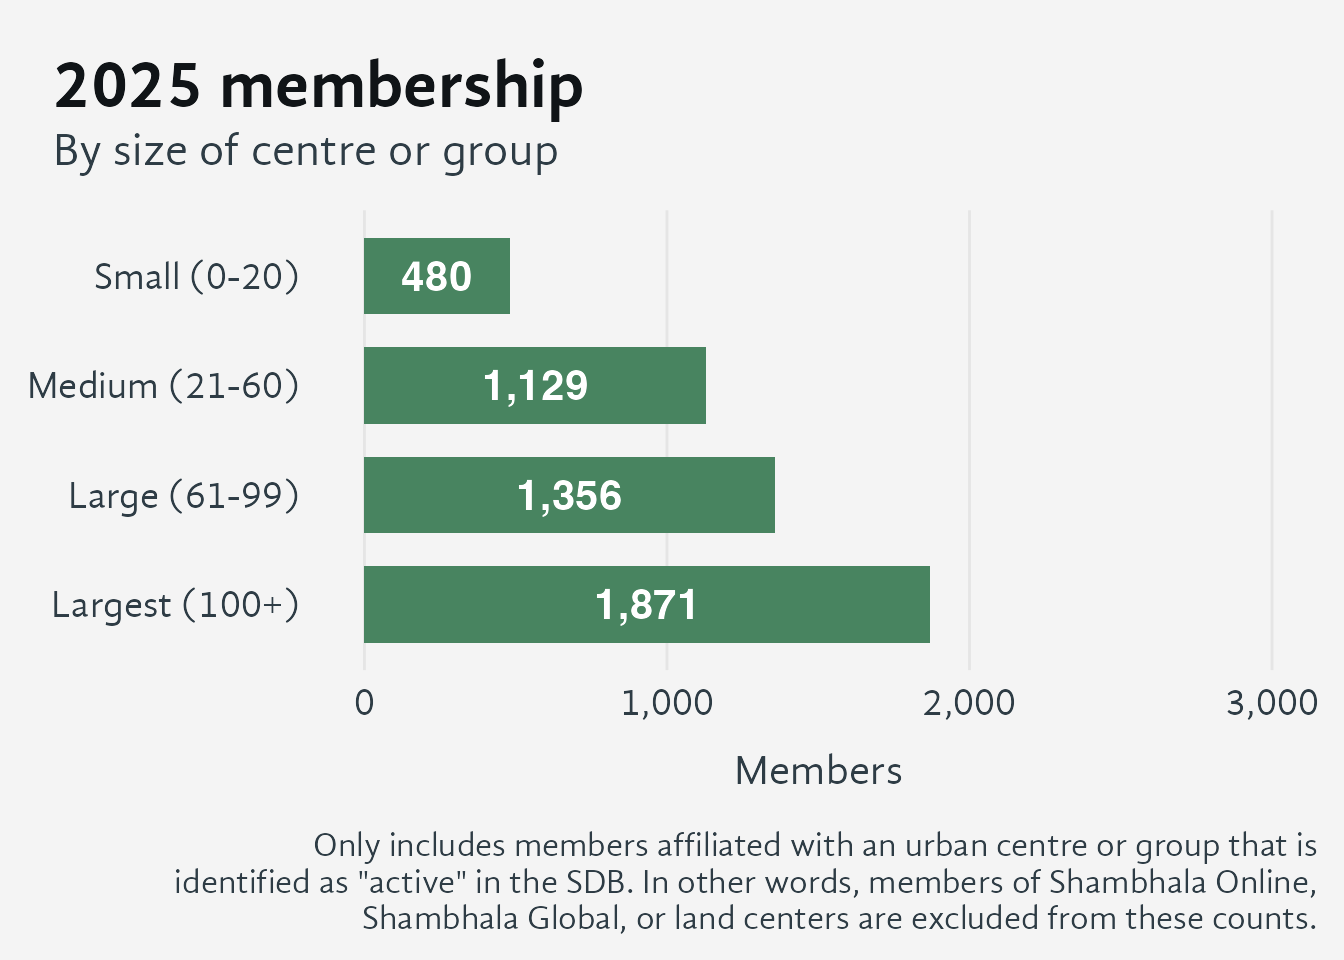
Though Shambhala has fewer of the largest centres, a substantial majority of members are affiliated with them. There are almost three times as many medium and small-sized centres as there are larger ones, and these extend Shambhala’s geographic reach into many communities. However, these smaller centres together have only half of the combined membership of the larger ones.

Active member counts vary considerably across GCC constellations. Some constellations are substantially larger than others, and cover regions varying greatly in size, with some designed to reflect factors apart from location (e.g. common language).
According to the Shambhala Database, 80% of current members are affiliated with an active centre or group. However what is also shown is that some 916 members are currently not affiliated. The reasons include the closure of their former centre or group.
6 New members
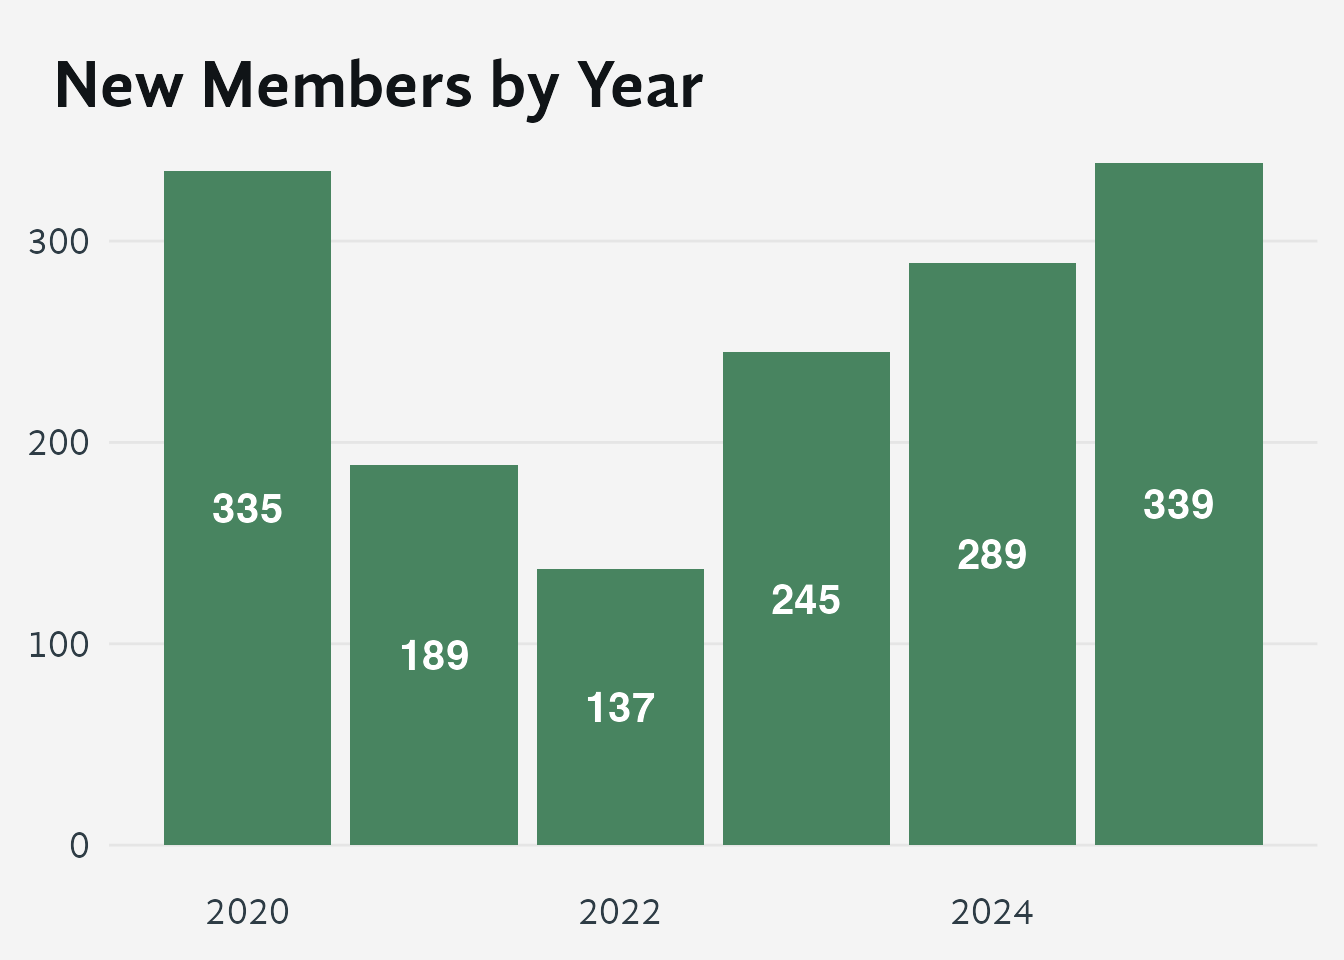
While new membership numbers were in decline from 2020 to 2022, they have increased steadily since that time,suggesting the community’s ability to attract and formalize new members may be improving. However, the growth needs to be considered against the substantial loss of membership which is shown in Figure 11 below.
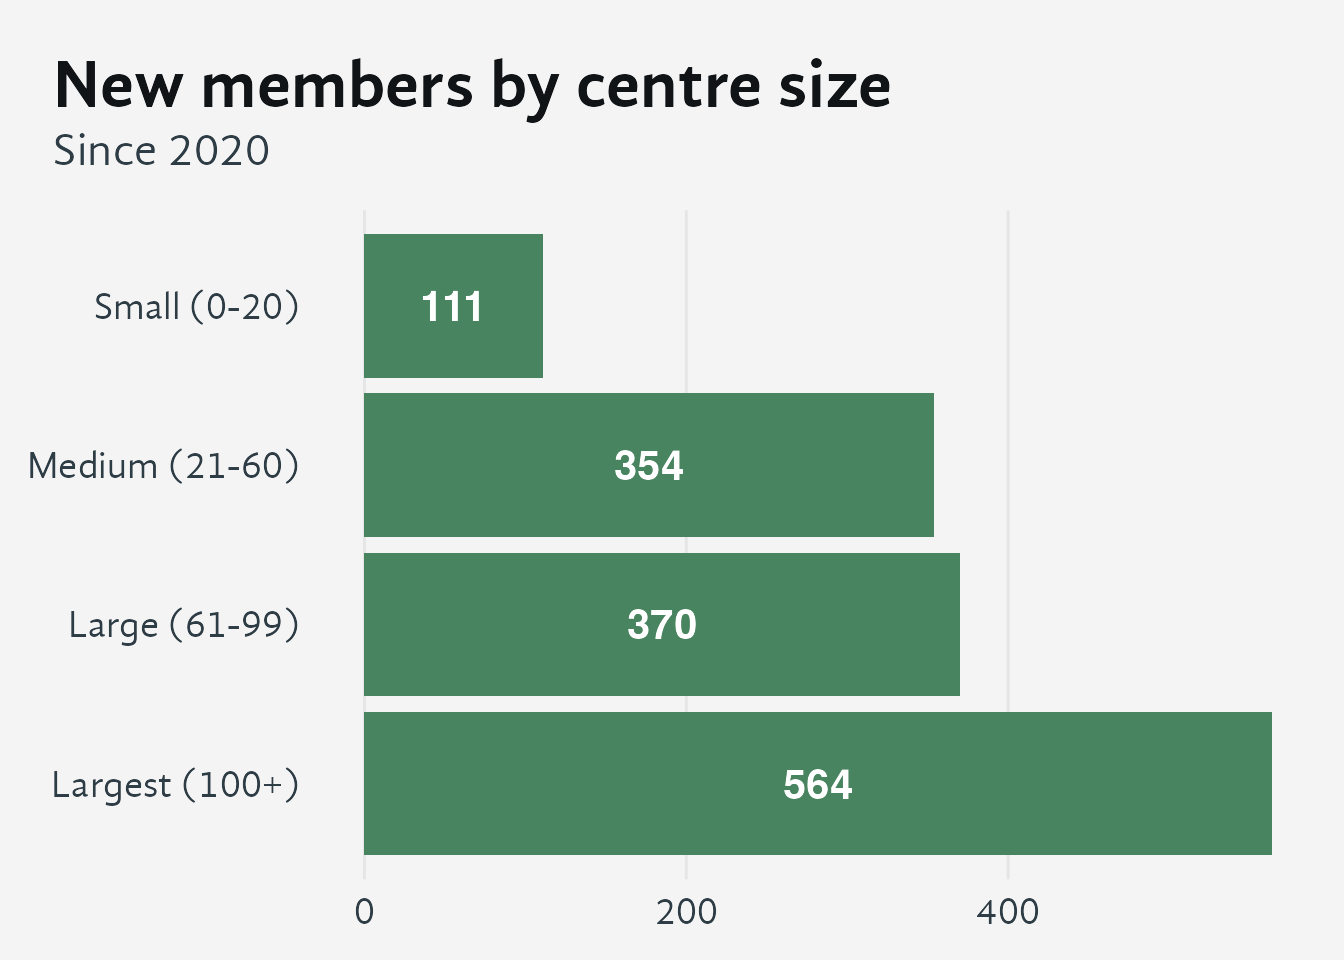
Larger centres have added the most new members in absolute terms since 2020. The callout below notes that when adjusting for size, the per-centre rate of new members is broadly similar across tiers, which speaks to the value of maintaining smaller centres for local access.
Note
Counting members by center size automatically excludes some from the count as a center’s “size” is only relevant for urban centers, not land centers or other categories.
While the largest centers added between 8 and 9 new members per year, the large centers added 4 or 5 and medium centers only added 2 new members a year, it still may be desirable from the viewpoint of world peace to have more small centers available to people.
| Comparison of current membership and new members since 2020 by centre size |
|||
| Centre size | Current membership |
New since 2020 |
|
|---|---|---|---|
| Small (0-20) | 10% | 8% | |
| Medium (21-60) | 23% | 25% | |
| Large (61-99) | 28% | 26% | |
| Largest (100+) | 39% | 40% | |
| Total | — | 100% | 100% |
This comparison of current membership and new members since 2020 by centre size shows that the per-centre rate of new members is broadly similar across tiers, which speaks to the value of supporting smaller centres for local access.
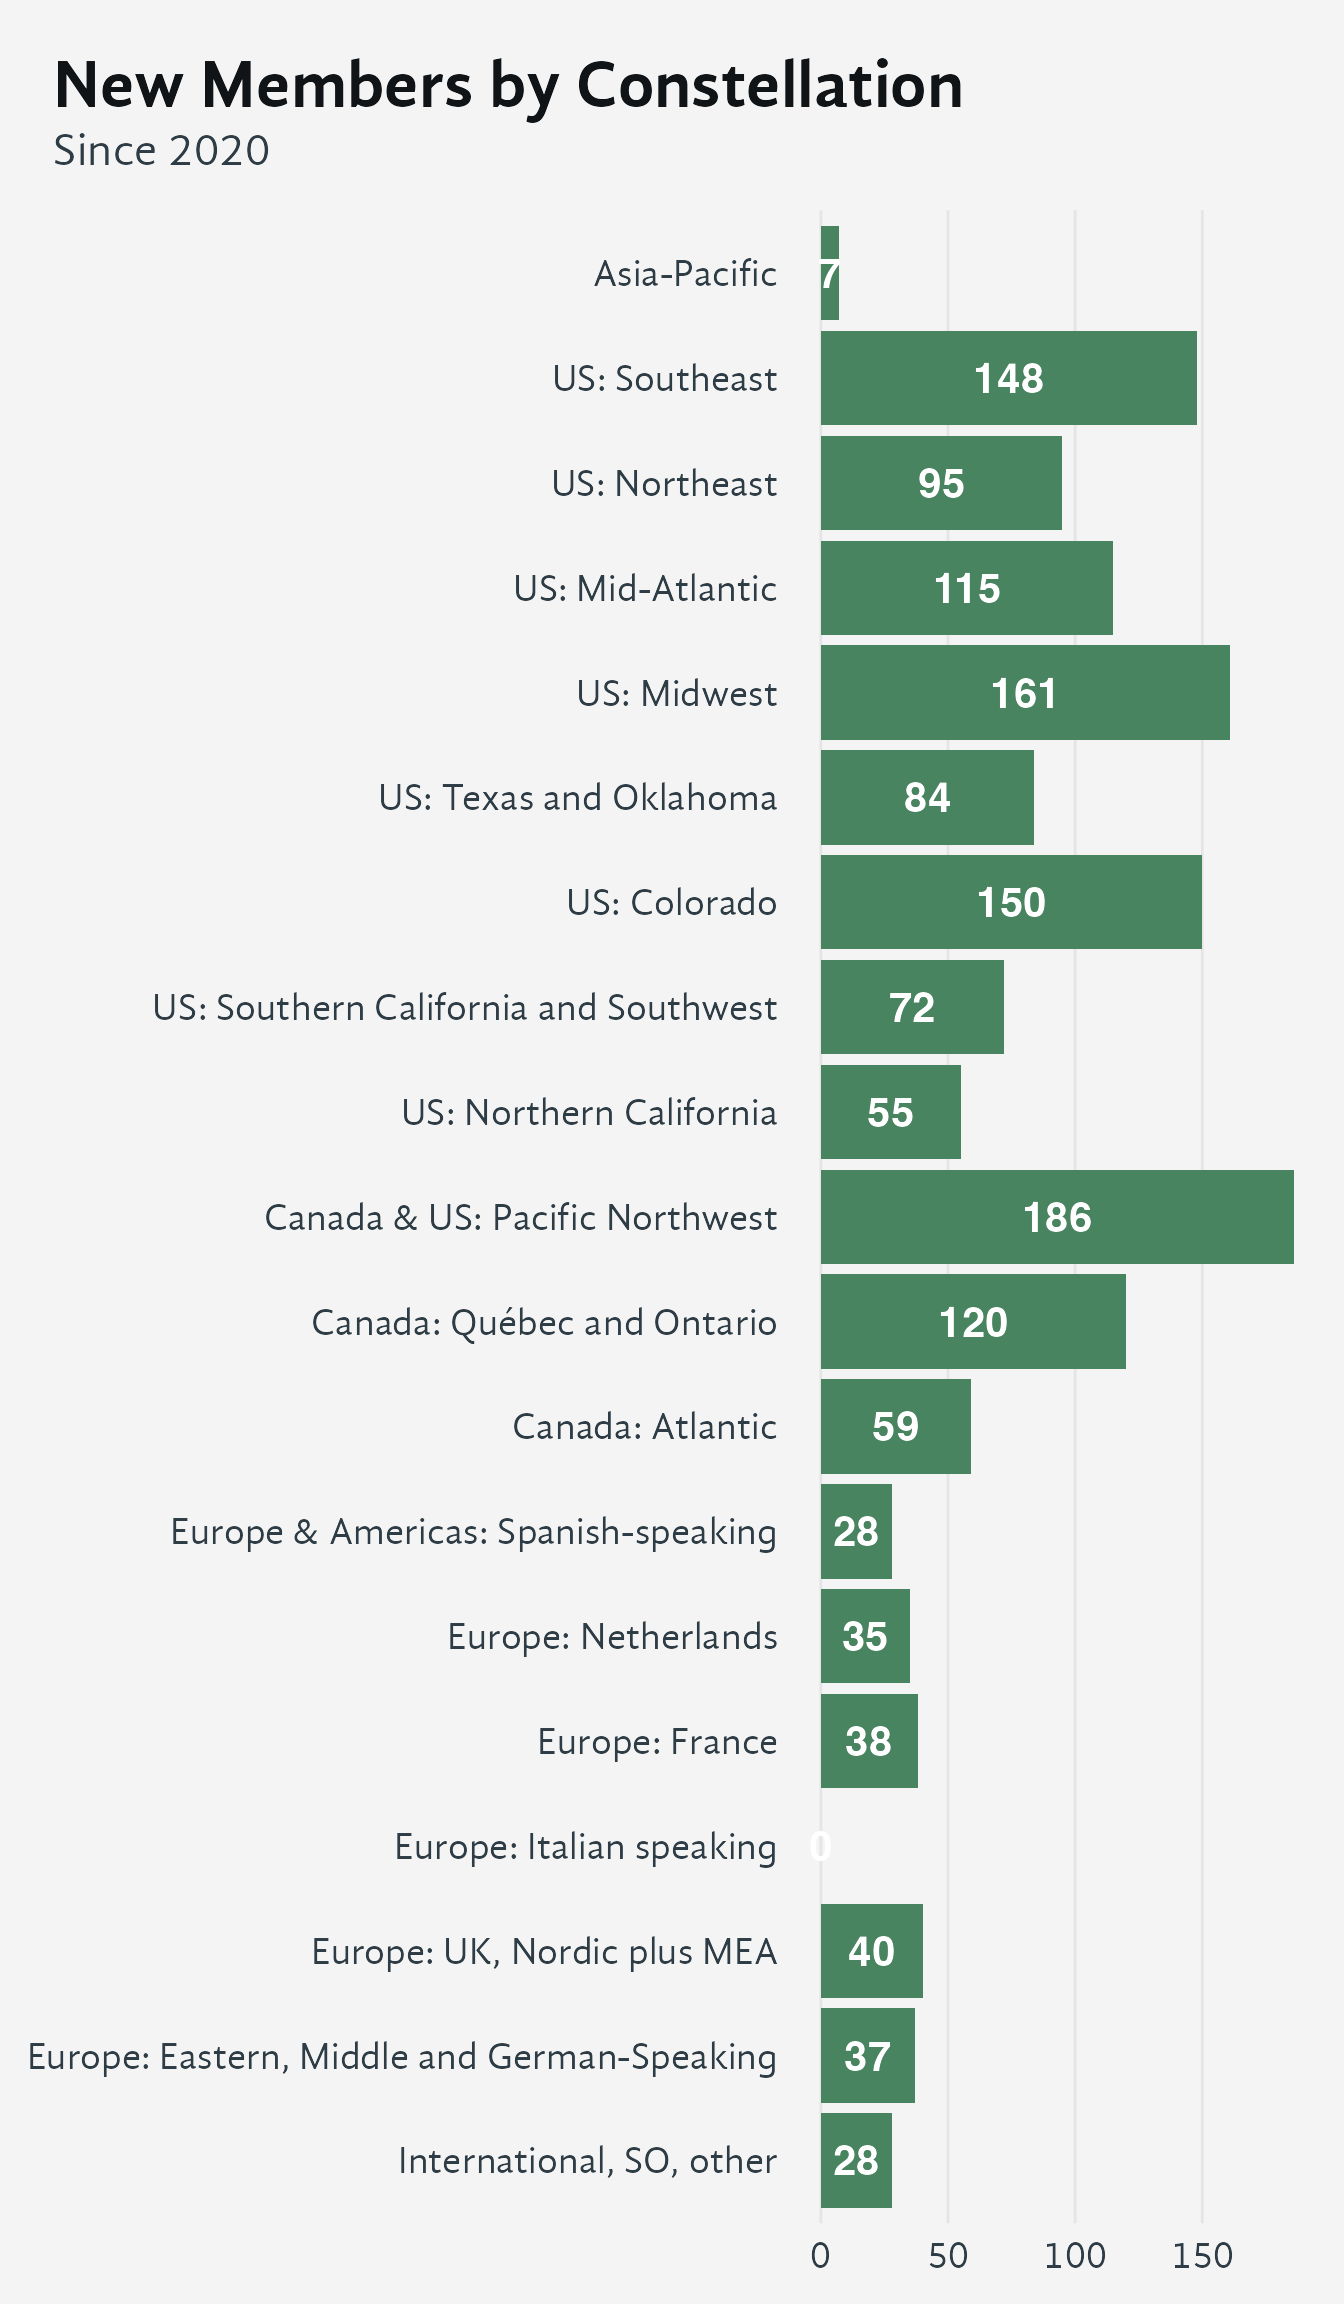
New member counts since 2020 vary considerably across GCC constellations, as they vary by total members, as well as number of centres.
7 Overall membership gains and losses

Losses consistently and substantially exceed gains in almost every year shown, with very strong declines shown in 2020, 2022 and 2025. While the annual count of new members has grown somewhat in recent years, and a portion of members each year become ‘friends’ instead of contributing members, the preponderance of departures over arrivals probably remains the central membership challenge for Shambhala.