Who are they

This page profiles the characteristics of survey respondents.
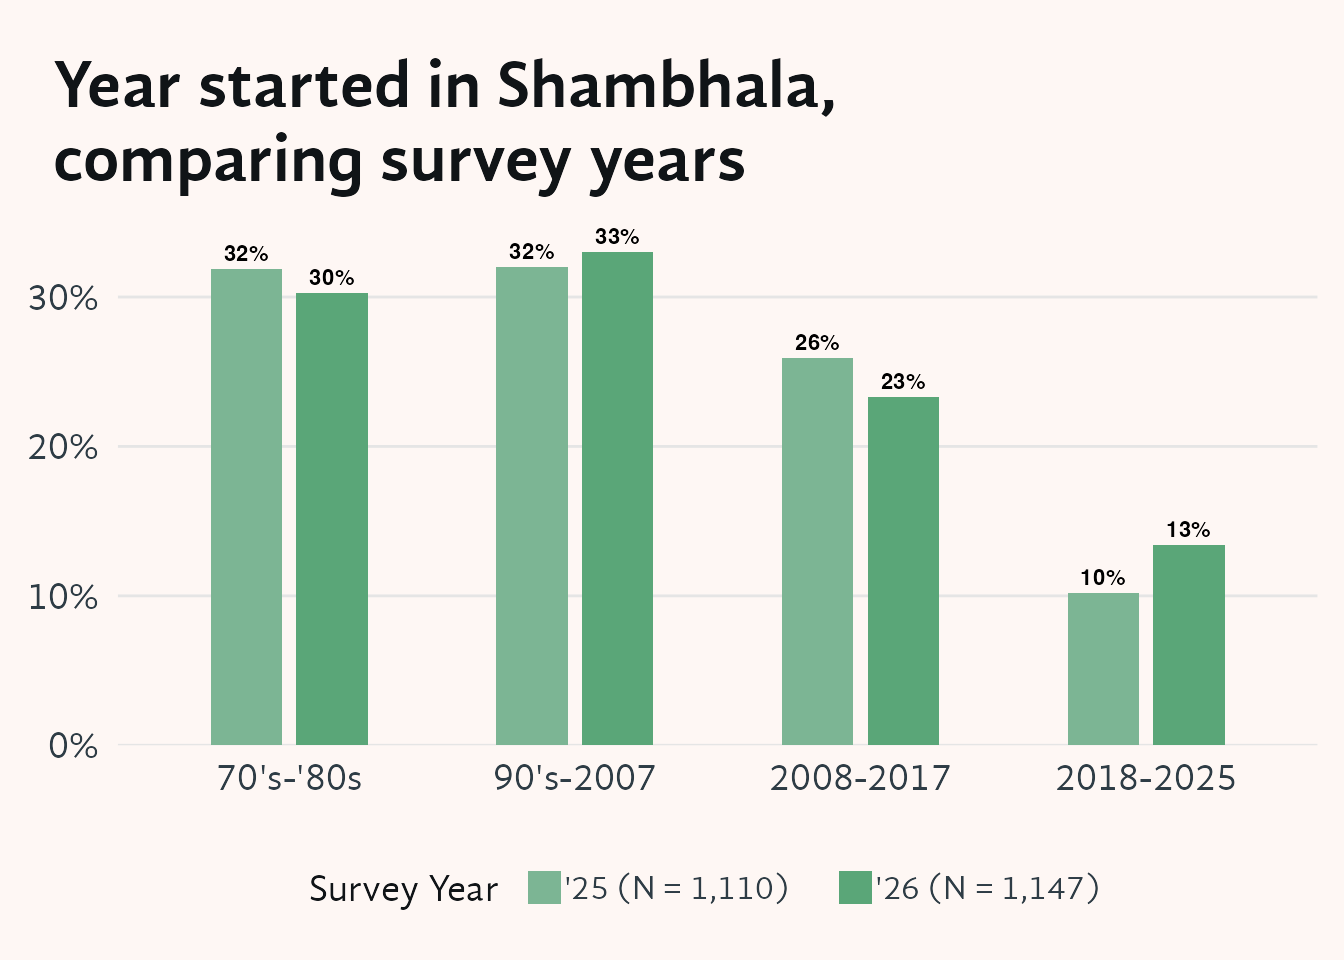
1 Comparing age structure of the current and last year’s survey respondents
In both survey years, more than half of respondents first connected with Shambhala before 2007 — a pattern that matches the broader membership composition seen in the Shambhala Database. The 2026 survey shows a higher share of respondents from the most recent cohort (2018–2025), while the share from the 2008–2017 period has declined.
2 Comparing age structure for the current and previous years

More than half of 2026 survey respondents are over age 65, consistent with prior years. The 2026 survey shows a higher share of respondents over 75 and a slight uptick under 35, but fewer in the 55–74 range — a shift that may reflect the declining participation of those who entered Shambhala between 2008 and 2017, who are now in their middle years.
3 Age structure of respondents who joined recently
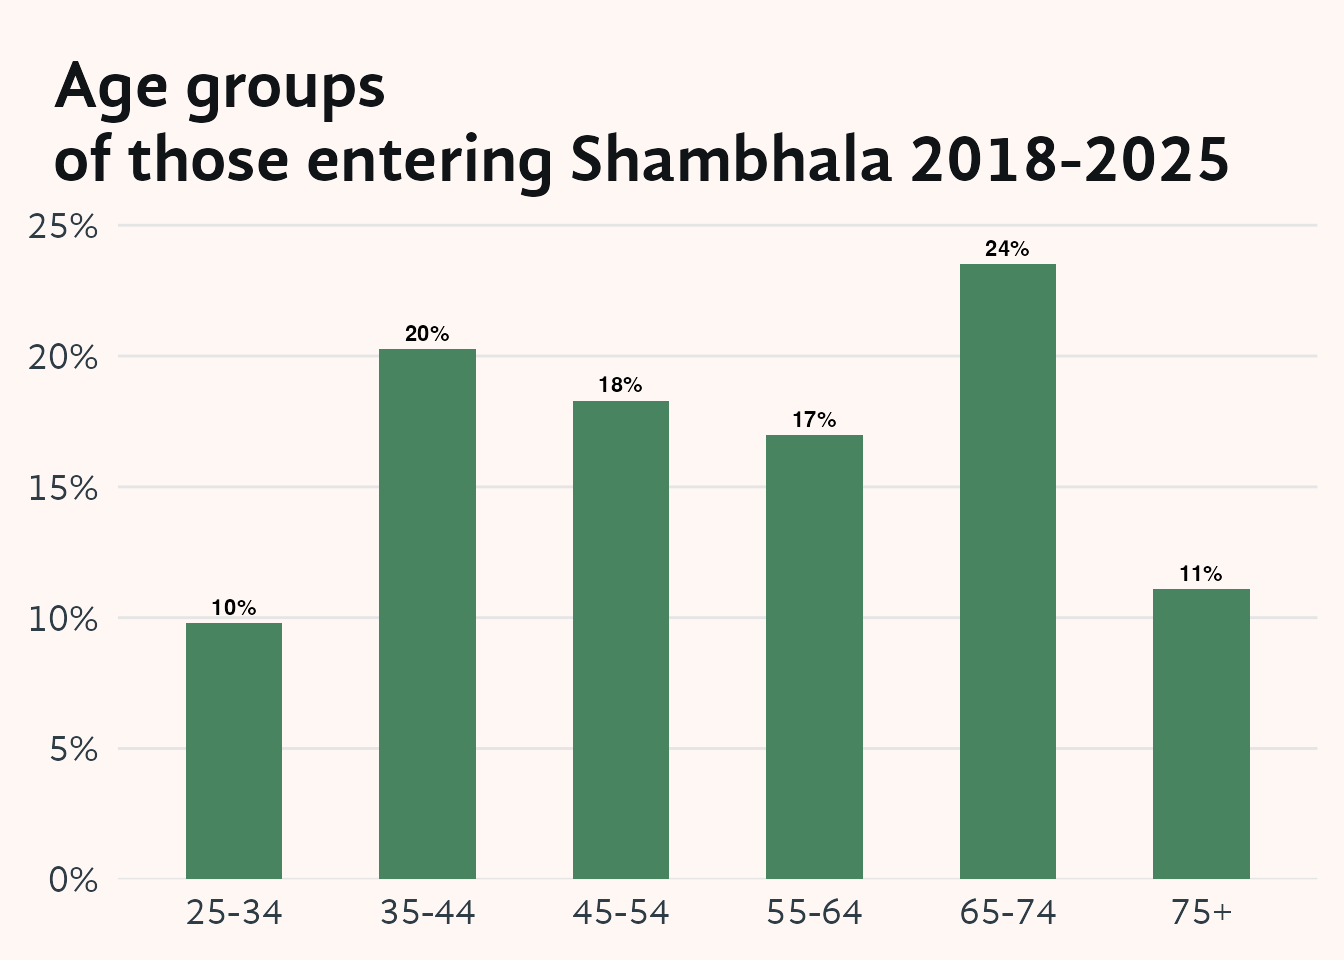
Those who have entered Shambhala since 2018 are younger than the overall respondent group, but at least a third are still over age 65. Two-thirds are under 65, yet very few are younger than 35 — even among the newest entrants, Shambhala has attracted relatively few people in their twenties and early thirties.
4 Do you currently relate to a Shambhala group or centre?
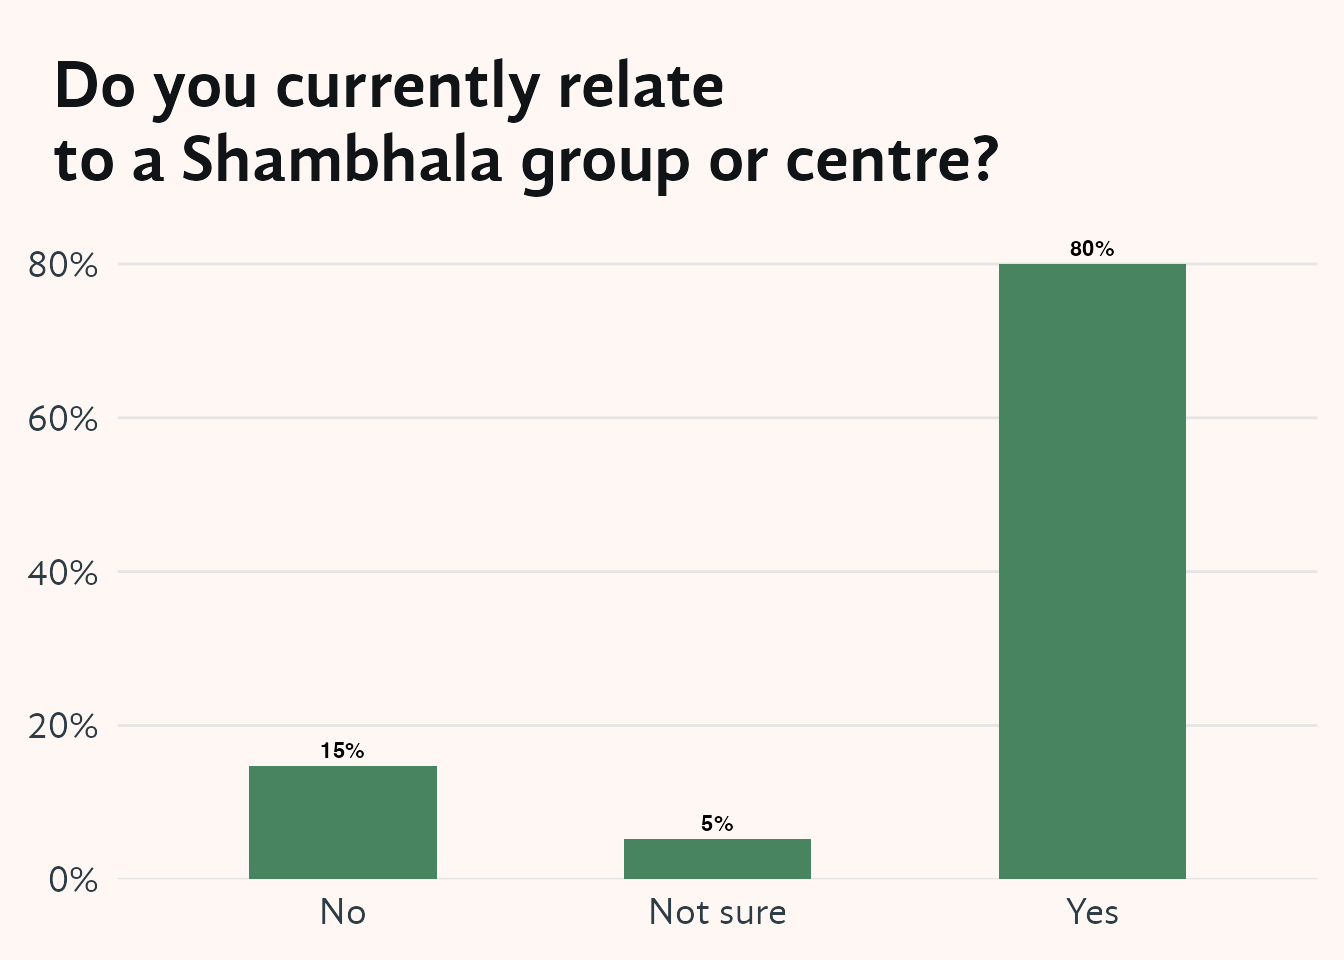
Eighty percent of survey respondents currently relate to a Shambhala group or centre, matching the proportion of members affiliated with active centres in the Shambhala Database. Among the remaining 20%, about one in four said they were unsure rather than saying no outright — suggesting some ambiguity about what centre affiliation means to them.
4.1 Interpretation
The high affiliation rate means that centre health and membership health are tightly coupled. When a centre closes, the members affiliated with it do not automatically transfer to another centre — many simply become inactive or lapse. This makes centre preservation one of the most direct levers available for membership retention. Conversely, it also means that investments in centre vitality (supporting teachers, providing resources, building leadership capacity) have a direct and measurable return in member retention.
5 Relationship to a centre or group by year started in Shambhala
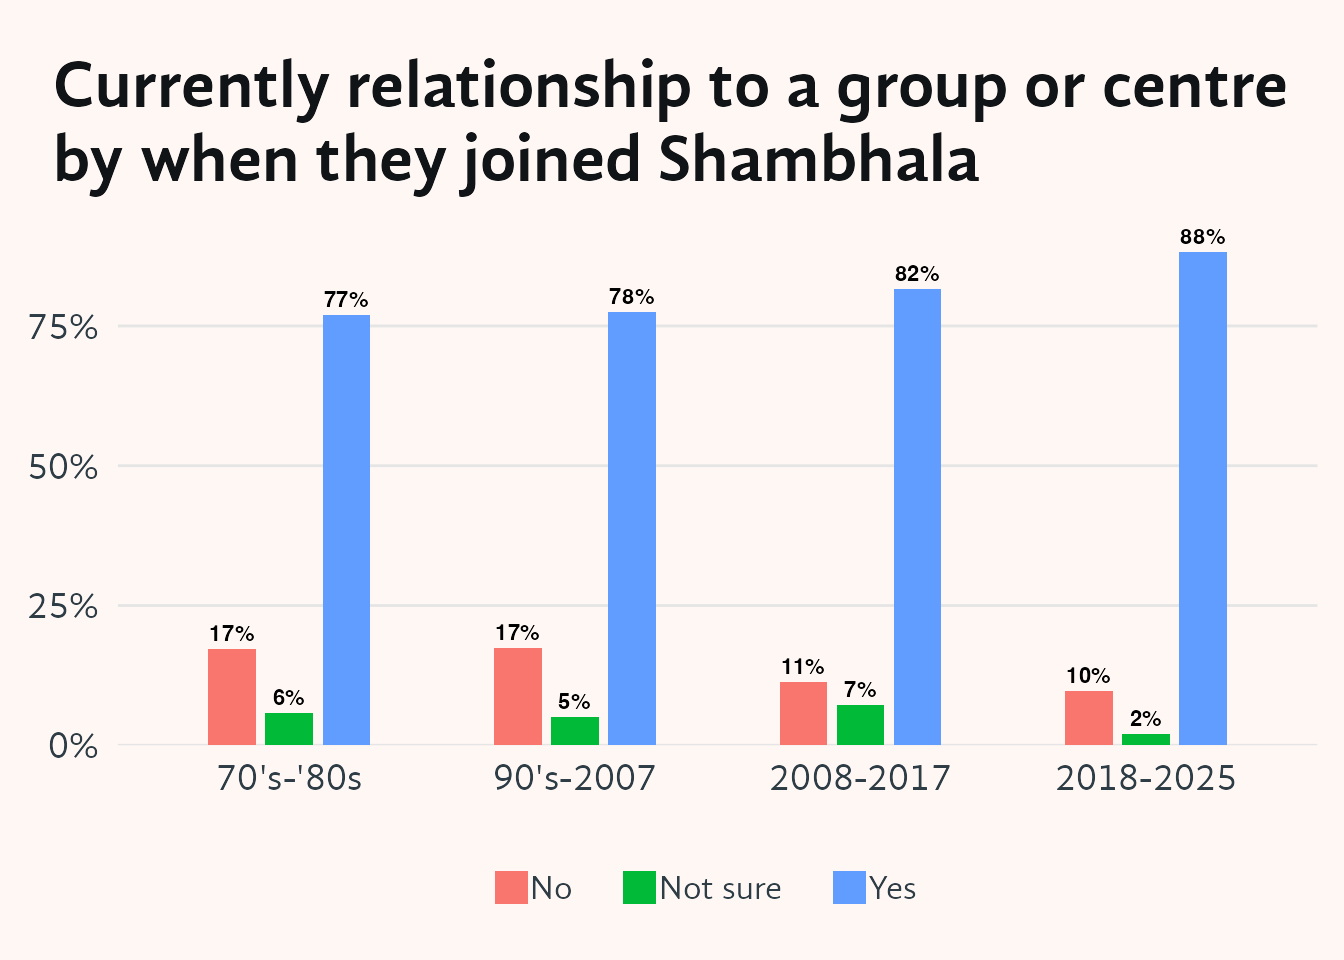
More recent entrants are more likely to relate to a group or centre than those who joined in earlier decades. Earlier joiners who no longer affiliate may have relocated away from active centres or their local centre may have dissolved. The highest share of “not sure” responses comes from the 2008–2017 cohort.