| Size of Centre / Group |
2023
|
2026
|
|||
|---|---|---|---|---|---|
| Centres Offering Programs | Centres with Members Participating (anywhere) | Centres Offering Programs | Centres with Members Participating (anywhere) | ||
| Small (0-20) | 14 | 44 | 16 | 45 | |
| Medium (21-60) | 32 | 38 | 27 | 38 | |
| Large (61-99) | 13 | 16 | 12 | 16 | |
| Largest (100+) | 12 | 13 | 11 | 13 | |
| Total | — | 71 | 111 | 66 | 112 |
Profiling center activity levels
Centres and groups are not simply “active” or “dissolved”. Between those two poles lies a spectrum: some centres run a full calendar of programs, some have members who take part elsewhere, some keep in regular touch with their community while holding few events, and some are fading, with hidden or dissolving status and lists that continue to shed subscribers after the meetings stop. Members sit on a similar spectrum, from those who are deeply involved in a local centre, through those who take part occasionally or only at other locations, to those who are affiliated on paper but no longer take part.
This year’s Mirror does not try to reduce that range to a single “active” count. This page offers four ways of glimpsing activity in centres and groups, each looking at a different facet. None is a complete measure, and where they disagree for a given centre, the disagreement is itself informative.
The page in brief
| View | What it looks at | Theme |
|---|---|---|
| Program registration | Whether a centre offers programs, and whether its members register for programs anywhere | Supply of programs versus participation by members |
| Newsletter reach | Subscribers relative to the number of members | Reach beyond formal membership |
| Newsletter subscriptions over time | Monthly joining and leaving rates, from January 2020 | Communication activity: pace, direction of change, and size effects |
| Indicators and login recency | A centre-by-centre table of five indicators of activity, plus how recently members and leaders log in, by centre size, and how that relates to the events a centre offers | Everyday engagement with the community’s online tools, compared across sizes |
In thumbnail: the number of centres has been roughly steady, but fewer centres now offer programs while members’ participation has held, so more members rely on a smaller set of program-offering centres. Newsletter lists across active centres are gaining subscribers at about the pace of several years ago and losing them somewhat more slowly. Differences between centres are much larger than changes over time, and small centres cannot fairly be compared with large ones on raw rates. The centre-by-centre indicators show the same pattern: medium and larger centres usually show most of the five indicators, while small centres range from all of them to none. Members’ recent logins are only loosely related to how many events a centre offers, so the two describe different parts of centre life.
1 Registration Activity Level Reflects on Centre vigor
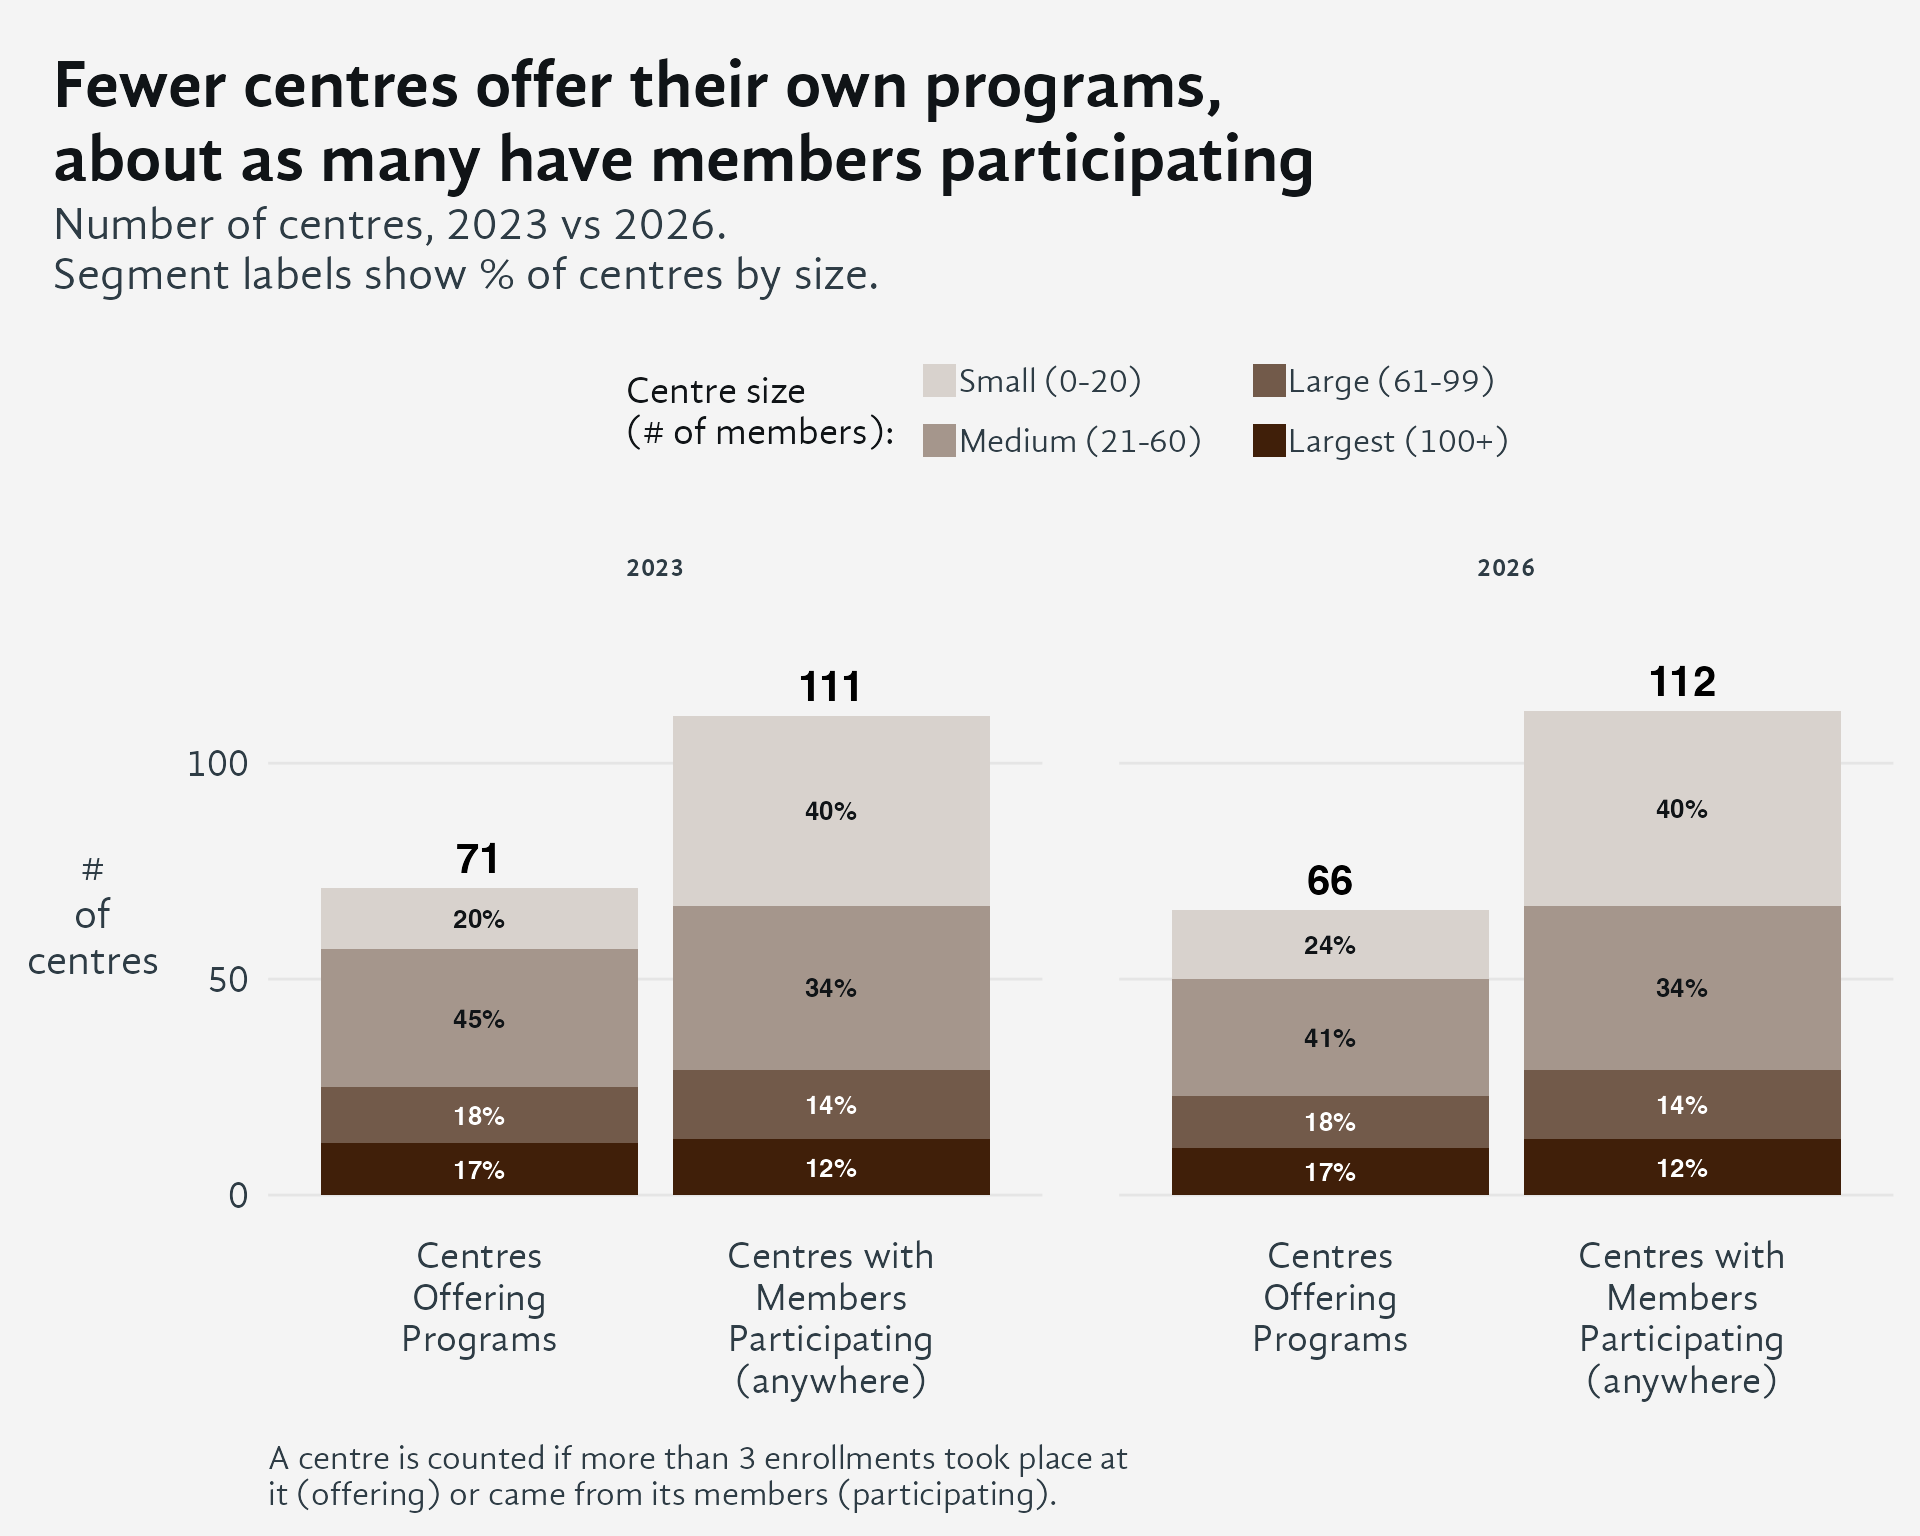
The overall number of centres is about the same in 2023 and 2026.
Between 2023 and 2026, the number of centres offering their own programs fell from 71 to 66, a drop of 5 centres (about 7%). Over the same period, the number of centres with members taking part in programs, at any centre, stayed almost the same: 111 in 2023 and 112 in 2026. The mix of centre sizes among participating centres did not change either (40% small, 34% medium, 14% large, 12% largest in both years).
This matters because member participation did not shrink along with the supply of programs. In 2026, 112 centres had members participating, but only 66 offered programs, so members at roughly 46 centres were taking part in programs run elsewhere. In 2023 that gap was about 40 centres. Small centres account for 40% of participating centres but only 24% of those offering programs, so they depend most on other centres. They probably lack the capacity to run many programs themselves, and their members attend programs at other centres. Enrollment totals support this: at least 33% of enrollments in 2023 and at least 27% in 2026 were at a centre other than the member’s home centre.
As fewer centres offer programs, more members depend on a smaller set of program-offering centres. If those centres cut back, the effect would reach well beyond their own members.
2 Newsletter Reach
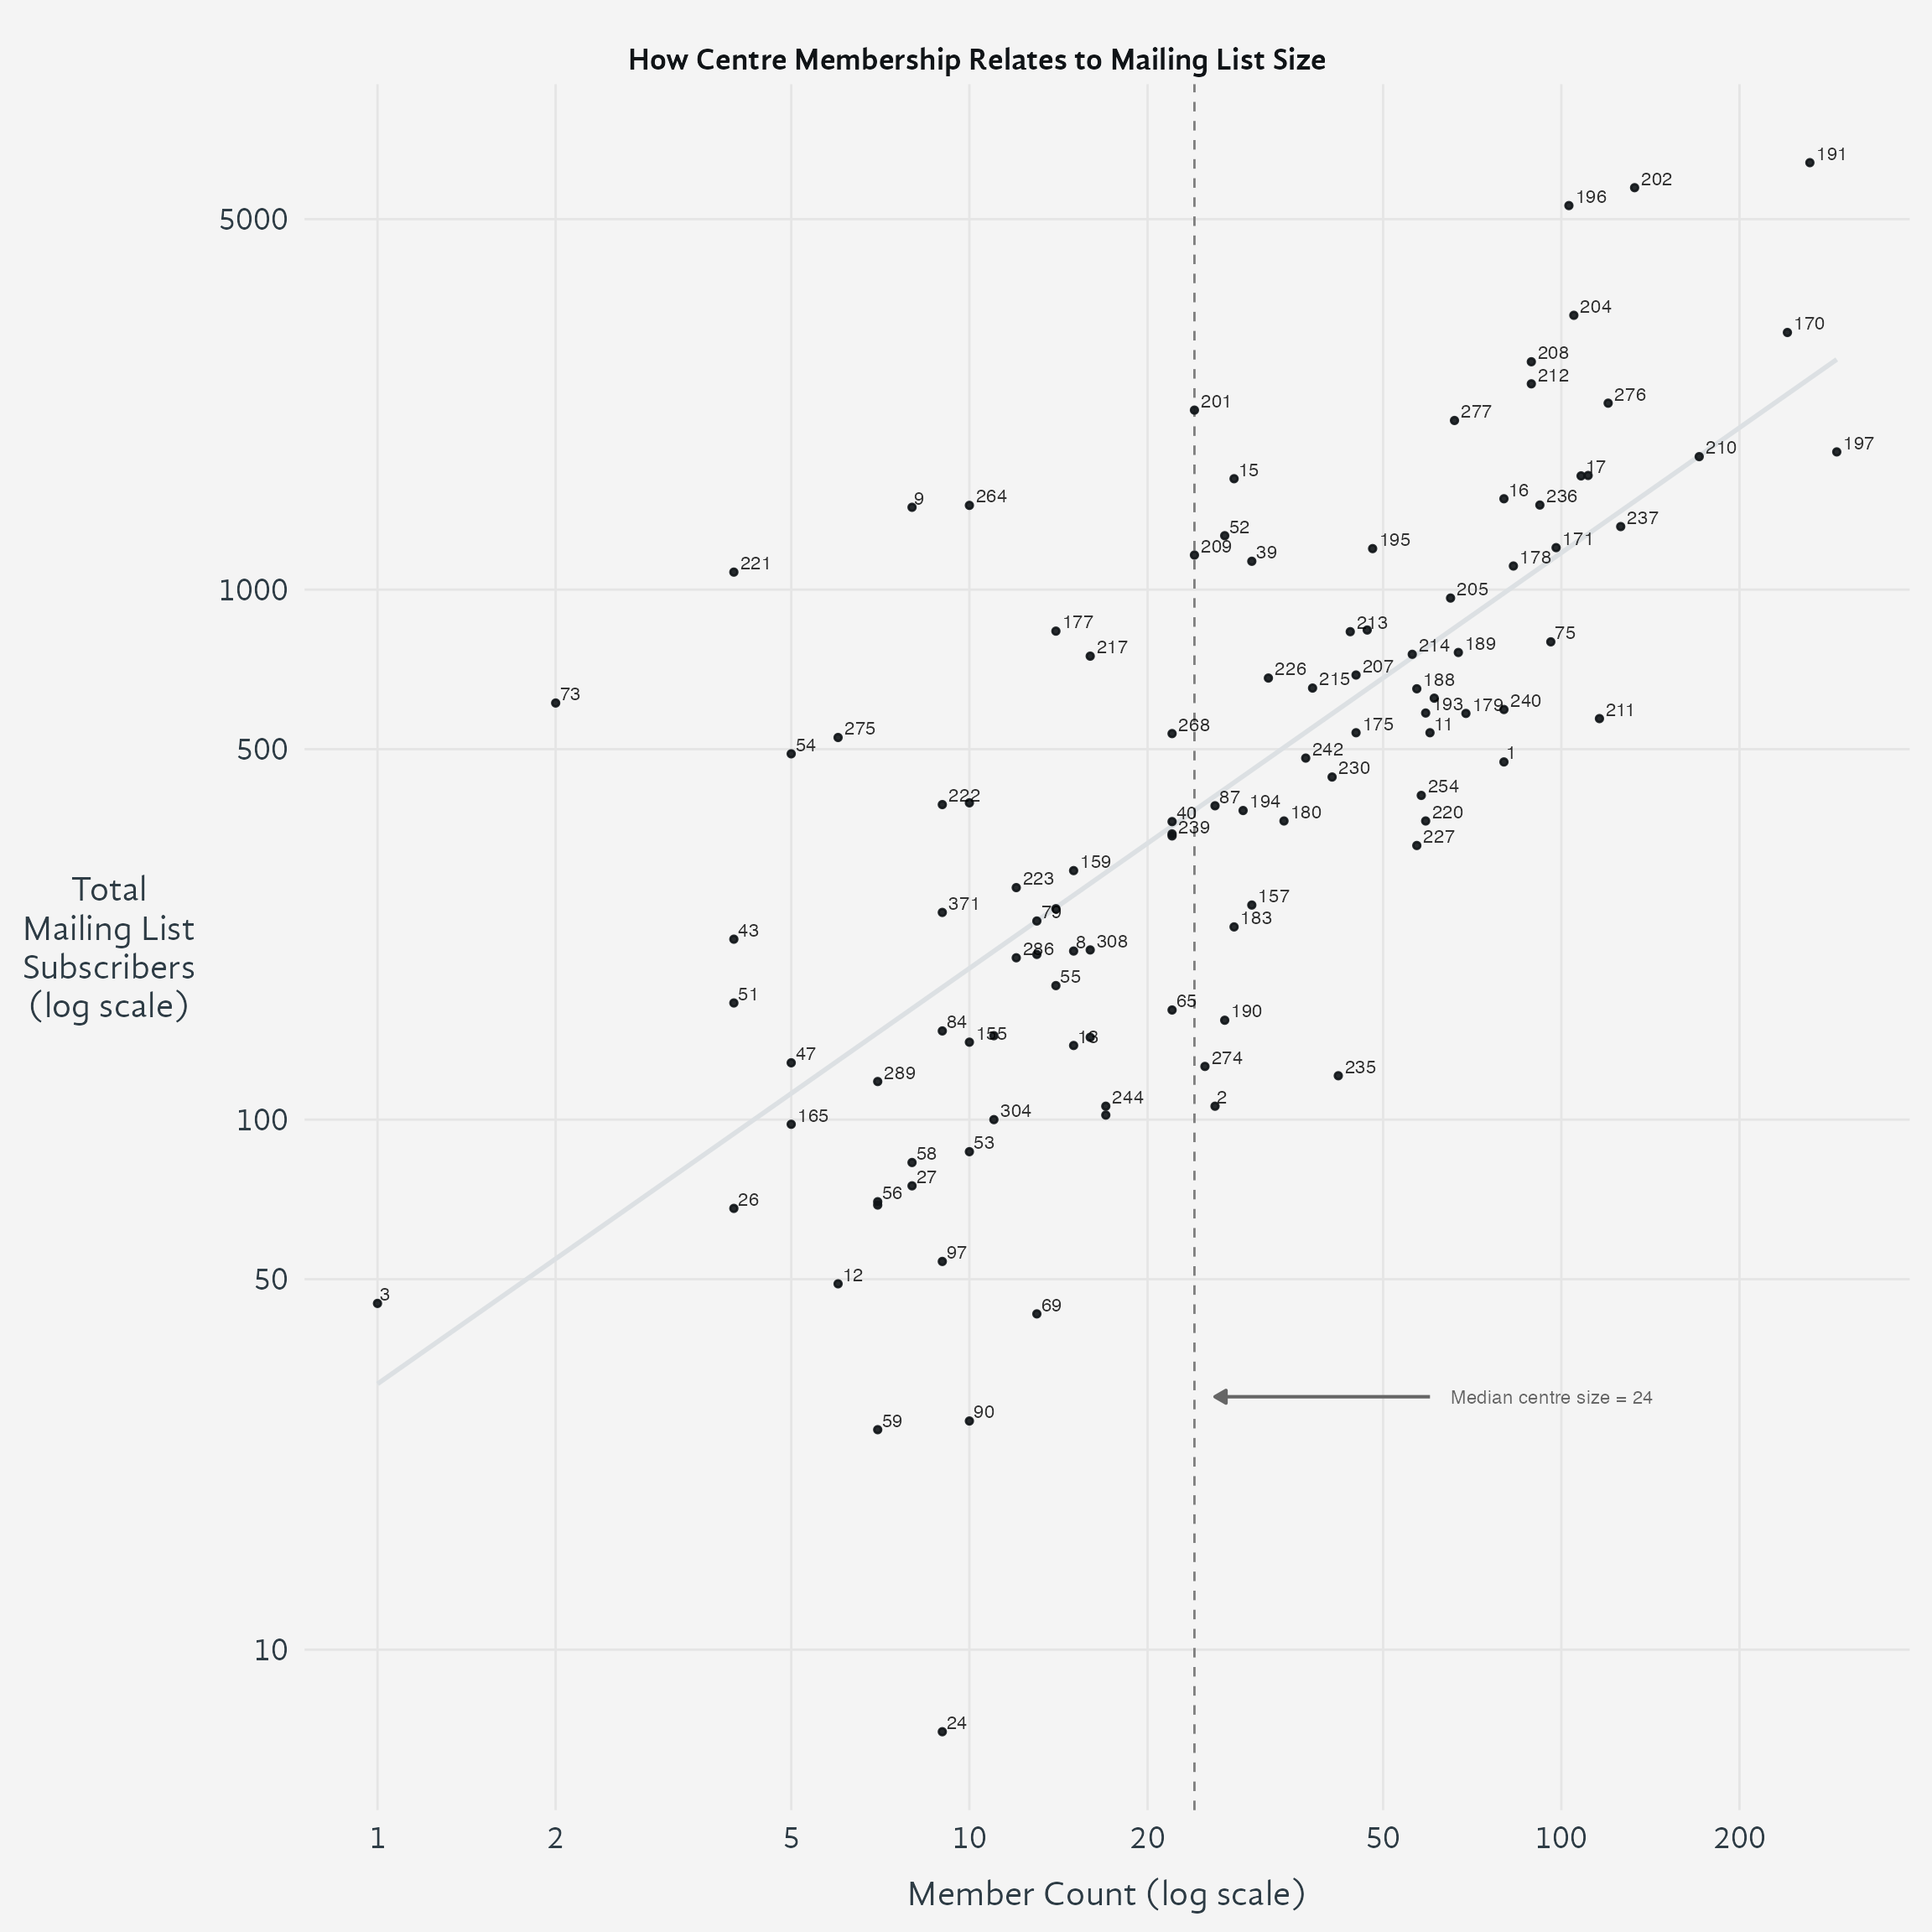
Log-log regression (R² = 0.48, slope = 0.78). Vertical distance from the line shows subscriber count relative to expectation based on member count. Centers above the line have more subscribers than typical for their size; centers below have fewer. Horizontal distance shows how much larger/smaller a center would need to be to achieve its subscriber count at typical rates. Dashed line shows median center size (24 members). Centers 5 and 68 excluded (non-regular centers).
2.1 Quadrant Analysis
The regression line and median center size divide the data into four regions, each revealing different patterns of center communication reach:
Upper Left (Small centers, above trend): This quadrant contains 20 centers with a median of 124% more subscribers than expected for their size. These smaller centers are dramatically over-performing in outreach relative to their member count. Are they under-counting members—perhaps tracking formal membership conservatively while maintaining broader mailing lists that include regular participants? Or are they genuinely excelling at digital outreach, using strong communication practices to build a subscriber base that extends well beyond their formal membership? They may serve as regional contact points, attracting interest from surrounding areas without formal centers.
Upper Right (Large centers, above trend): This quadrant contains 28 centers with a median of 51% more subscribers than expected. These larger centers maintain subscriber lists that exceed expectations even for their size. They likely represent well-established centers with strong organizational infrastructure for communication, possibly with dedicated staff or volunteers managing digital outreach. Their position suggests both scale and effectiveness—communities large enough to support robust communication operations and skilled enough to engage audiences beyond their immediate membership base.
Lower Left (Small centers, below trend): This quadrant contains 31 centers with a median of 49% fewer subscribers than expected. These smaller centers have subscriber counts lower than expected even for their modest size. This pattern may indicate centers that are newly forming, experiencing leadership transition, or relying primarily on in-person communication networks. Some may lack the volunteer capacity or technical expertise to maintain robust mailing lists, while others might intentionally focus on intimate community building rather than broader digital outreach.
Lower Right (Large centers, below trend): This quadrant contains 28 centers with a median of 31% fewer subscribers than expected. These centers present a puzzling pattern—substantial membership but relatively modest subscriber counts. Are they over-counting members, perhaps including inactive or lapsed individuals on their membership rolls? Or do they rely on alternative communication methods such as social media, direct messaging, or in-person networks? Some may be established communities where long-standing members stay connected through channels other than formal newsletters, or populations less engaged with email communication.
3 Newsletter Subscriptions as an indicator of communication activity
Every centre and group has an email newsletter list, and it’s the one way of reaching out that we can measure consistently across all of them. So we use how fast a centre’s list gains and loses subscribers as a stand-in for how actively that centre is staying in touch with people.
Where the information comes from
The figures below cover 107 active centres and groups. For each one we counted how many people joined its mailing list and how many left, month by month, from January 2020 to the present. That gives every centre its own run of monthly figures — about 78 months each, and 8,374 monthly observations across the whole network. Looking month by month, rather than just at a single before-and-after total, lets us see whether a centre’s pattern is changing over time, not just where it ended up.
Only centres that are currently active are included. Hidden and dissolving centres also have newsletter lists, and those lists keep shedding subscribers long after the centre stops meeting — counting them would measure the closure of centres rather than the communication activity of the ones that remain.
Four cautions belong with every number here
Joining is scaled by current list size, so that measure is growth relative to the list a centre already has, not a recruitment rate — a large list must add more people to post the same rate.
Newsletter growth measures administrative activity as much as community vitality. One energetic volunteer importing event attendees grows a list without anything changing in the shrine room.
Many centres bypass the SDB’s list management entirely, usually with a completely independent MailChimp or other email list service that is not linked to the SDB.
Small centres cannot be compared with large ones on equal terms. At a centre with a few dozen subscribers, one person joining or leaving moves the rate dramatically; at a centre with a few thousand, it barely registers. For this reason no ranked table of centres appears below, and none should be made from these figures: most of the ordering would be noise.
Newsletter subscriptions across Shambhala groups and centres are heading in a good direction. People are joining lists at about the same pace as several years ago, and fewer people are unsubscribing than before.
Email remains a workable way for centres and groups to stay in touch with their community.
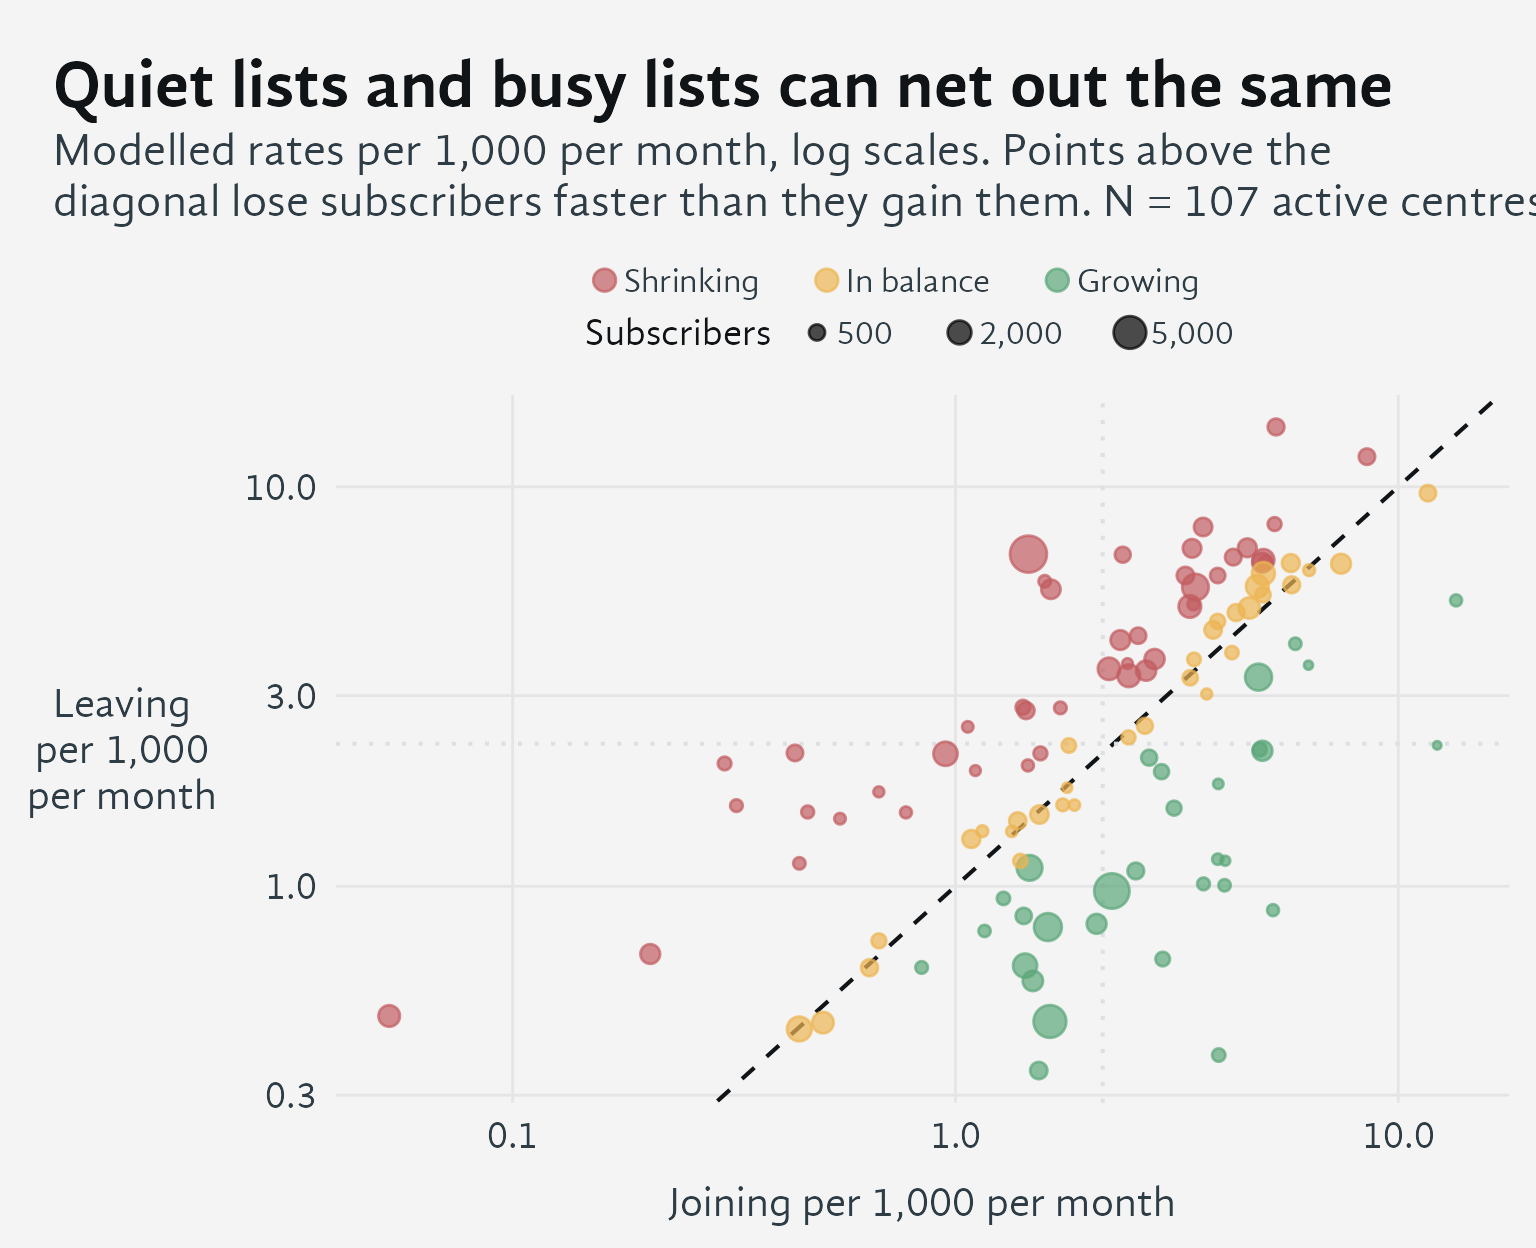
How to read this graph. The diagonal line marks where a centre’s list is neither growing nor shrinking — people are joining and leaving at the same rate. Points above the line are losing subscribers faster than they gain them; points below are growing. Distance from that line shows how lopsided the gain or loss is.
Position along the line tells a different story: how much traffic the list has overall. Two centres can land at the same distance from the line — the same net gain or loss — while one barely has anyone joining or leaving, and the other has many people joining and leaving each month that happen to roughly cancel out. Both look the same in net terms, but one list is quiet and the other is constantly in flux.
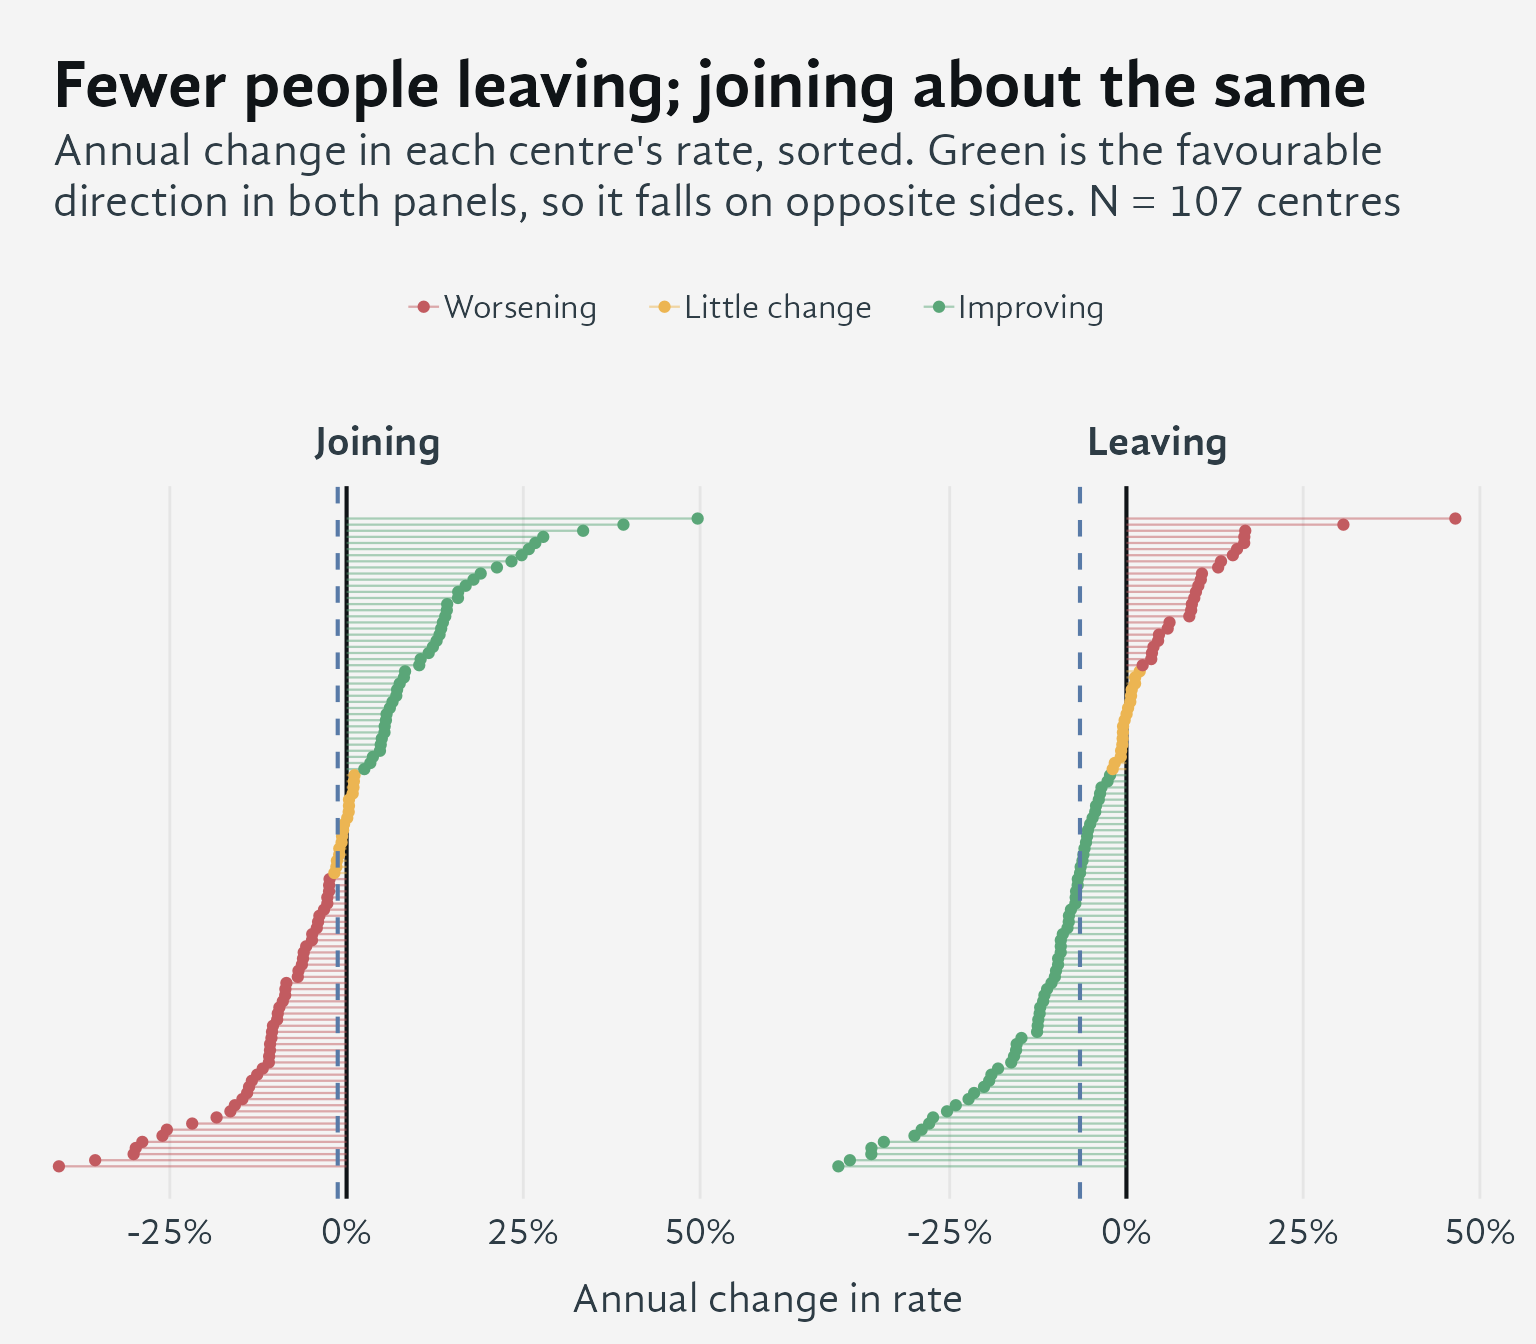
How to read this graph. Green always marks good news, not just “the number went up.” On the left panel, green means more people joining. On the right panel, green means fewer people leaving — so on that side, green sits where the rate is falling. Colouring both panels by “is this good or bad” rather than “is this number rising or falling” is what lets them be compared at a glance.
Each line is one centre. The two panels tell different stories. Leaving is easing: about seven centres in ten are losing subscribers more slowly than they used to. Joining, on the other hand, isn’t really moving one way or the other — centres split almost evenly between rising and falling, and taken together they show no real change.
That second finding is worth stating plainly, because it’s easy to glance at the left panel and read it as a decline. It isn’t. Across active centres, the pace at which people join newsletter lists has stayed roughly flat.
How these estimates are calculated
The dashed line in each panel is the network-wide average trend, derived from a statistical model that fits negative binomial mixed model that eliminates some of the noise in the data due to center size.
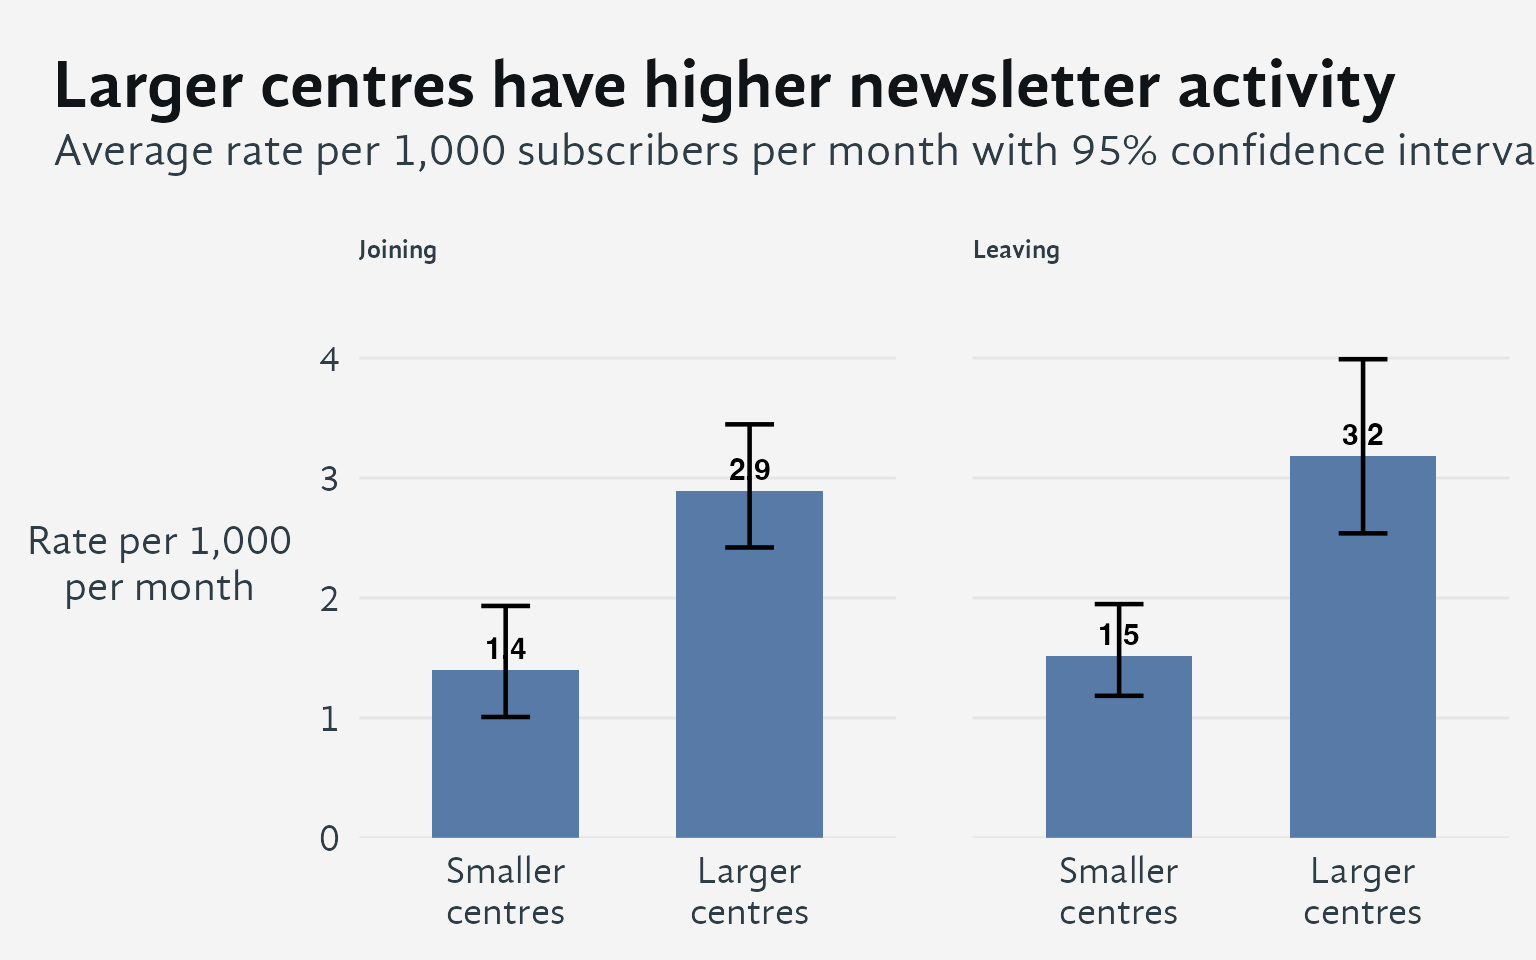
How to read this chart. Larger centres have roughly double the newsletter activity of smaller centres in both directions. They add more subscribers per 1,000 and also lose more per 1,000. This higher turnover likely reflects both more active list management and larger, more diverse communities where people’s engagement naturally varies more.
The distinction matters because a rate of 3 per 1,000 means something different at a large centre than at a small one. Small centres naturally have lower absolute activity, so comparing them directly to large centres would be misleading.
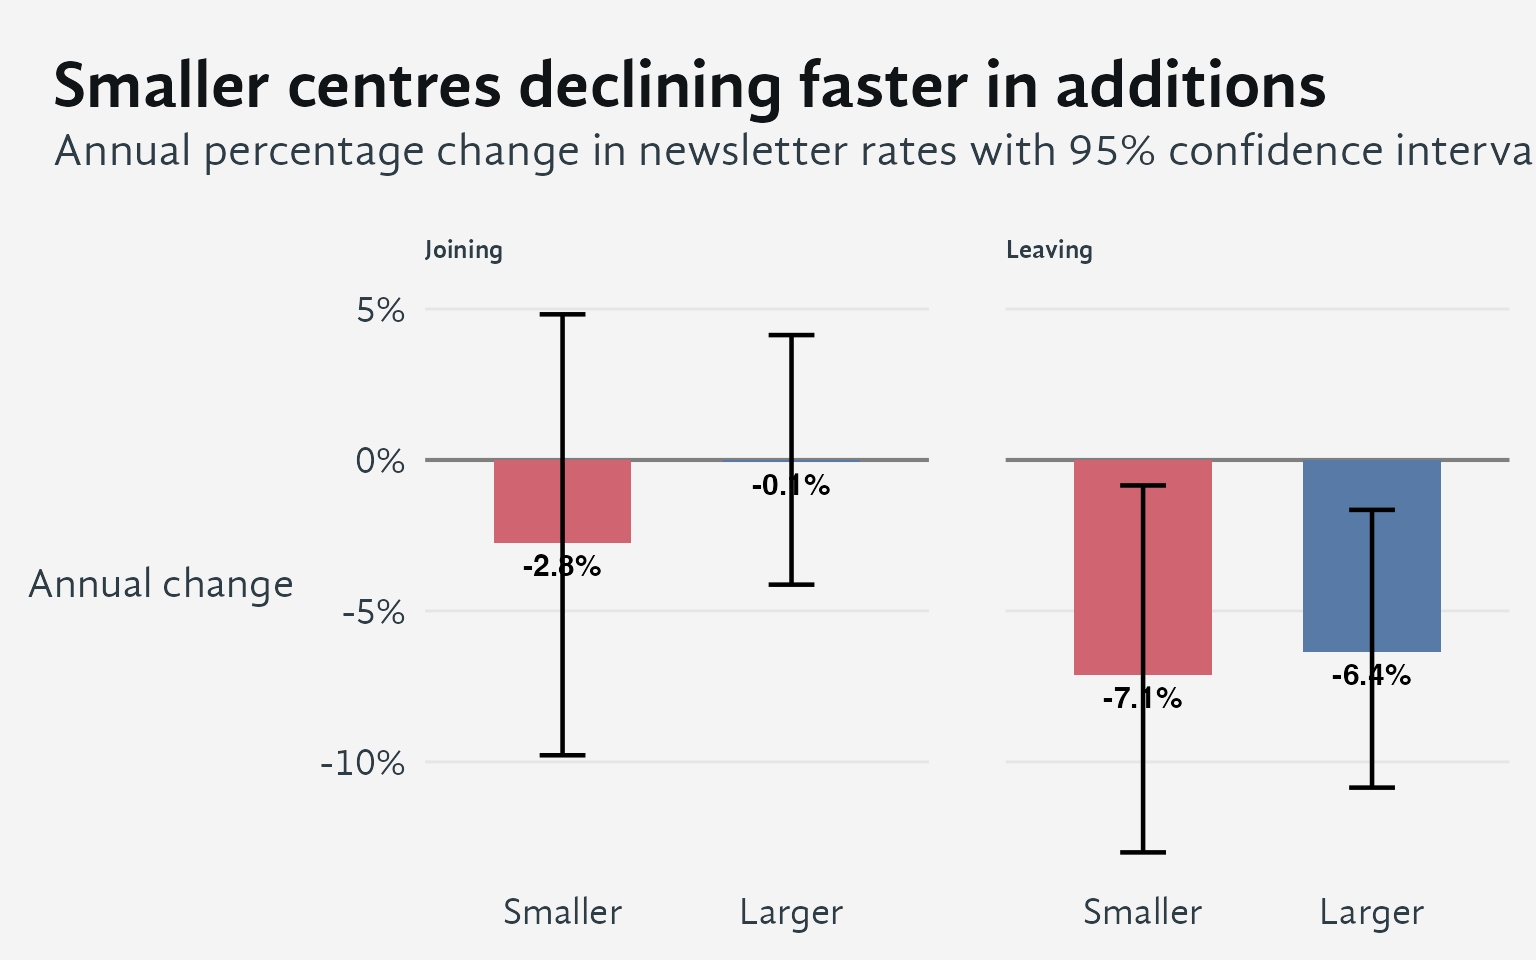
Key finding: While both size groups show similar improvement in retention (fewer people leaving), their recruitment patterns diverge. Larger centres have maintained stable addition rates, while smaller centres show a modest decline. This suggests that larger centres may have more sustained capacity for list growth, while smaller centres face greater challenges in maintaining recruitment momentum.
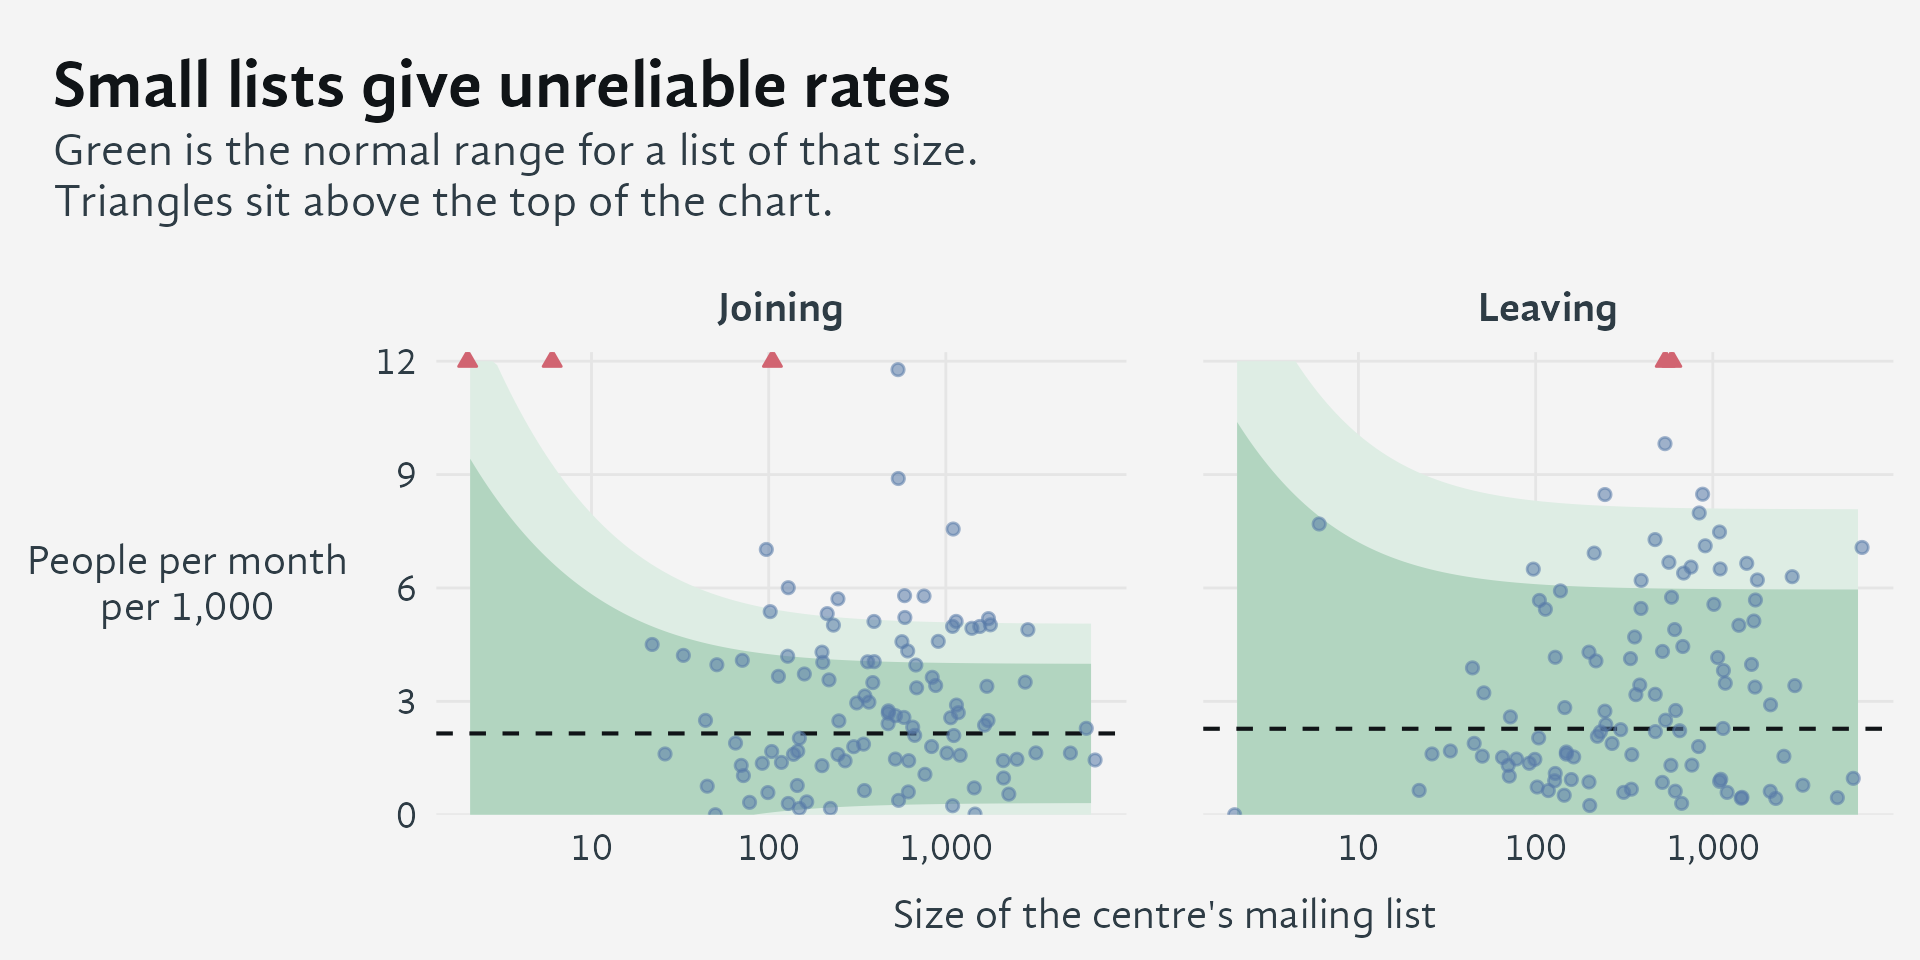
How to read it. Each dot is one centre. Its position left to right is the size of its mailing list; its height is how many people join or leave in a typical month, per 1,000 subscribers. The green shading marks the range of rates that would be unremarkable for a list of that size.
The shading is wide on the left and narrow on the right, and that shape is the whole point. A centre with 30 subscribers might see one person leave one month and nobody the next — expressed as a rate per 1,000, that swings enormously without anything real having changed at the centre. A centre with 3,000 subscribers can’t swing like that, because no single person moves the number much. So the same rate means something quite different depending on how big the list is.
That means the centres worth paying attention to are the ones sitting outside the shading on the right-hand side, where lists are large enough for the number to be trusted. Their higher turnover reflects a real difference in how their lists are run. A small centre sitting well above or below the average is, most of the time, just telling you that it’s small.
How the shaded range is calculated
The shading shows the spread of month-to-month variation that’s normal for a centre of a given size, based on how the numbers behave across the whole network — it accounts for the fact that small centres naturally see more random swings from month to month than large ones do. It does not include the genuine, lasting differences between how actively different centres run their lists; folding that in would make the bands so wide that nothing would ever fall outside them, defeating the purpose of the chart.
Why this looks different from an earlier version
An earlier version of this analysis included centres that had gone quiet or closed, and it reported a steep network-wide decline in both measures. That decline was mostly the natural die-off of mailing lists belonging to centres that had stopped meeting. That’s a real fact about Shambhala, but it’s a fact about centres closing, not about how actively the centres that remain are communicating.
Because list growth reflects office and volunteer effort as much as community life, it’s best read alongside the centre-as-institution survey rather than on its own. When the two disagree for a given centre, that disagreement tells you more than either number alone.
4 Indicators of activity, centre by centre
NoteCentre-by-indicator table (click to expand)
Each row is a centre or group. A green check mark means the centre shows that indicator of activity; a pale blank cell means it does not. Within each size group, centres are listed from most to fewest members.
| Centre | Members | # indicators1 | Offers programs2 | Members enrol3 | Members log in4 | Leader logs in5 | Newsletter in use6 |
|---|---|---|---|---|---|---|---|
| Small (0-20) | |||||||
| Annapolis | 17 | 3 | ✓ | ✓ | ✓ | ||
| Wellington | 17 | 2 | ✓ | ✓ | |||
| Dallas | 16 | 4 | ✓ | ✓ | ✓ | ✓ | |
| Budapest | 16 | 2 | ✓ | ✓ | |||
| Dartmouth | 16 | 1 | ✓ | ||||
| Bern | 15 | 4 | ✓ | ✓ | ✓ | ✓ | |
| Szczecin | 15 | 3 | ✓ | ✓ | ✓ | ||
| Adelaide | 15 | 1 | ✓ | ||||
| Hoosier Heartland | 14 | 4 | ✓ | ✓ | ✓ | ✓ | |
| Copenhagen | 14 | 3 | ✓ | ✓ | ✓ | ||
| San Francisco | 14 | 3 | ✓ | ✓ | ✓ | ||
| Bristol | 13 | 4 | ✓ | ✓ | ✓ | ✓ | |
| Tulsa | 13 | 3 | ✓ | ✓ | ✓ | ||
| Tatamagouche | 13 | 1 | ✓ | ||||
| Kamloops | 12 | 4 | ✓ | ✓ | ✓ | ✓ | |
| Houston | 12 | 2 | ✓ | ✓ | |||
| Troy | 11 | 2 | ✓ | ✓ | |||
| Cuernavaca/Tepoztlan | 11 | 1 | ✓ | ||||
| Palm Beach County | 10 | 3 | ✓ | ✓ | ✓ | ||
| Bangkok | 10 | 3 | ✓ | ✓ | ✓ | ||
| Cuenca | 10 | 2 | ✓ | ✓ | |||
| Limoges | 10 | 1 | ✓ | ||||
| Penedès | 10 | 0 | |||||
| Oslo | 9 | 4 | ✓ | ✓ | ✓ | ✓ | |
| Fredericton | 9 | 4 | ✓ | ✓ | ✓ | ✓ | |
| Melbourne | 9 | 3 | ✓ | ✓ | ✓ | ||
| Rennes | 9 | 2 | ✓ | ✓ | |||
| Teheran | 9 | 1 | ✓ | ||||
| Alcoy | 8 | 2 | ✓ | ✓ | |||
| Lucca | 8 | 1 | ✓ | ||||
| Milano | 8 | 0 | |||||
| Shelburne Falls | 7 | 2 | ✓ | ✓ | |||
| Prince Edward Island | 7 | 2 | ✓ | ✓ | |||
| Kingston | 7 | 0 | |||||
| Longmont | 7 | 0 | |||||
| Mississauga | 6 | 4 | ✓ | ✓ | ✓ | ✓ | |
| Ivano-Frankivsk | 6 | 1 | ✓ | ||||
| Krakow | 5 | 4 | ✓ | ✓ | ✓ | ✓ | |
| Zurich | 5 | 3 | ✓ | ✓ | ✓ | ||
| Pucón | 5 | 3 | ✓ | ✓ | ✓ | ||
| Kiev | 5 | 2 | ✓ | ✓ | |||
| Bourg-Argental | 4 | 4 | ✓ | ✓ | ✓ | ✓ | |
| Utrecht | 4 | 2 | ✓ | ✓ | |||
| Haarlem | 4 | 2 | ✓ | ✓ | |||
| Edmonton | 4 | 1 | ✓ | ||||
| Warsaw | 2 | 1 | ✓ | ||||
| Tbilisi | 1 | 2 | ✓ | ✓ | |||
| Odessa | 1 | 0 | |||||
| Medium (21-60) | |||||||
| Vienna | 60 | 4 | ✓ | ✓ | ✓ | ✓ | |
| Lexington | 59 | 4 | ✓ | ✓ | ✓ | ✓ | |
| Durham | 59 | 4 | ✓ | ✓ | ✓ | ✓ | |
| San Diego | 58 | 5 | ✓ | ✓ | ✓ | ✓ | ✓ |
| Fort Collins | 57 | 2 | ✓ | ✓ | |||
| New Haven | 57 | 2 | ✓ | ✓ | |||
| Portland | 56 | 4 | ✓ | ✓ | ✓ | ✓ | |
| Minneapolis | 48 | 5 | ✓ | ✓ | ✓ | ✓ | ✓ |
| St. Petersburg | 47 | 4 | ✓ | ✓ | ✓ | ✓ | |
| Milwaukee | 45 | 5 | ✓ | ✓ | ✓ | ✓ | ✓ |
| Birmingham | 45 | 4 | ✓ | ✓ | ✓ | ✓ | |
| Pioneer Valley | 44 | 5 | ✓ | ✓ | ✓ | ✓ | ✓ |
| St. Margarets Bay | 42 | 3 | ✓ | ✓ | ✓ | ||
| Ottawa | 41 | 5 | ✓ | ✓ | ✓ | ✓ | ✓ |
| Burlington | 38 | 4 | ✓ | ✓ | ✓ | ✓ | |
| Bellingham | 37 | 1 | ✓ | ||||
| Sonoma | 34 | 5 | ✓ | ✓ | ✓ | ✓ | ✓ |
| Madison | 32 | 5 | ✓ | ✓ | ✓ | ✓ | ✓ |
| Marseille | 30 | 5 | ✓ | ✓ | ✓ | ✓ | ✓ |
| Montpellier France | 30 | 4 | ✓ | ✓ | ✓ | ✓ | |
| Nelson | 29 | 4 | ✓ | ✓ | ✓ | ✓ | |
| Paris | 28 | 5 | ✓ | ✓ | ✓ | ✓ | ✓ |
| San Rafael | 28 | 4 | ✓ | ✓ | ✓ | ✓ | |
| Madrid | 27 | 4 | ✓ | ✓ | ✓ | ✓ | |
| Lviv | 27 | 0 | |||||
| Ticino | 26 | 5 | ✓ | ✓ | ✓ | ✓ | ✓ |
| Stockholm | 26 | 4 | ✓ | ✓ | ✓ | ✓ | |
| Calgary | 25 | 1 | ✓ | ||||
| Albany | 24 | 5 | ✓ | ✓ | ✓ | ✓ | ✓ |
| Baltimore | 24 | 4 | ✓ | ✓ | ✓ | ✓ | |
| Rotterdam | 22 | 4 | ✓ | ✓ | ✓ | ✓ | |
| Albuquerque | 22 | 4 | ✓ | ✓ | ✓ | ✓ | |
| Gainesville | 22 | 3 | ✓ | ✓ | ✓ | ||
| Auckland | 22 | 2 | ✓ | ✓ | |||
| Munich | 22 | 1 | ✓ | ||||
| Large (61-99) | |||||||
| Toronto | 98 | 4 | ✓ | ✓ | ✓ | ✓ | |
| Cologne | 96 | 5 | ✓ | ✓ | ✓ | ✓ | ✓ |
| Vancouver | 92 | 5 | ✓ | ✓ | ✓ | ✓ | ✓ |
| Los Angeles | 89 | 5 | ✓ | ✓ | ✓ | ✓ | ✓ |
| Austin | 89 | 5 | ✓ | ✓ | ✓ | ✓ | ✓ |
| Berkeley | 83 | 4 | ✓ | ✓ | ✓ | ✓ | |
| Cleveland | 80 | 5 | ✓ | ✓ | ✓ | ✓ | ✓ |
| Marburg | 80 | 4 | ✓ | ✓ | ✓ | ✓ | |
| London | 80 | 4 | ✓ | ✓ | ✓ | ✓ | |
| Davis | 69 | 5 | ✓ | ✓ | ✓ | ✓ | ✓ |
| Montreal | 67 | 5 | ✓ | ✓ | ✓ | ✓ | ✓ |
| Sao Paulo | 66 | 1 | ✓ | ||||
| Washington DC | 65 | 3 | ✓ | ✓ | ✓ | ||
| Columbus | 61 | 2 | ✓ | ✓ | |||
| Largest (100+) | |||||||
| Halifax | 292 | 5 | ✓ | ✓ | ✓ | ✓ | ✓ |
| Boulder | 263 | 4 | ✓ | ✓ | ✓ | ✓ | |
| Chicago | 241 | 4 | ✓ | ✓ | ✓ | ✓ | |
| Philadelphia | 171 | 4 | ✓ | ✓ | ✓ | ✓ | |
| New York | 133 | 5 | ✓ | ✓ | ✓ | ✓ | ✓ |
| Victoria | 126 | 4 | ✓ | ✓ | ✓ | ✓ | |
| Santiago | 120 | 1 | ✓ | ||||
| Seattle | 116 | 4 | ✓ | ✓ | ✓ | ✓ | |
| Denver | 111 | 5 | ✓ | ✓ | ✓ | ✓ | ✓ |
| Amsterdam | 108 | 5 | ✓ | ✓ | ✓ | ✓ | ✓ |
| Boston | 105 | 4 | ✓ | ✓ | ✓ | ✓ | |
| Atlanta | 103 | 3 | ✓ | ✓ | ✓ | ||
| 1 The five indicators are practical markers, not validated measures; the thresholds are judgement calls. | |||||||
| 2 Visible calendar events in the past 12 months, or more than 3 enrollments at the centre this year. | |||||||
| 3 More than 3 enrollments this year came from the centre's members, wherever they took place. | |||||||
| 4 At least 10% of the centre's members logged in within the past 90 days. | |||||||
| 5 Someone holding a leadership role at the centre logged in within the past 30 days. | |||||||
| 6 The centre has a mailing list with subscribers that was used in the past year. | |||||||
5 Login recency and programs
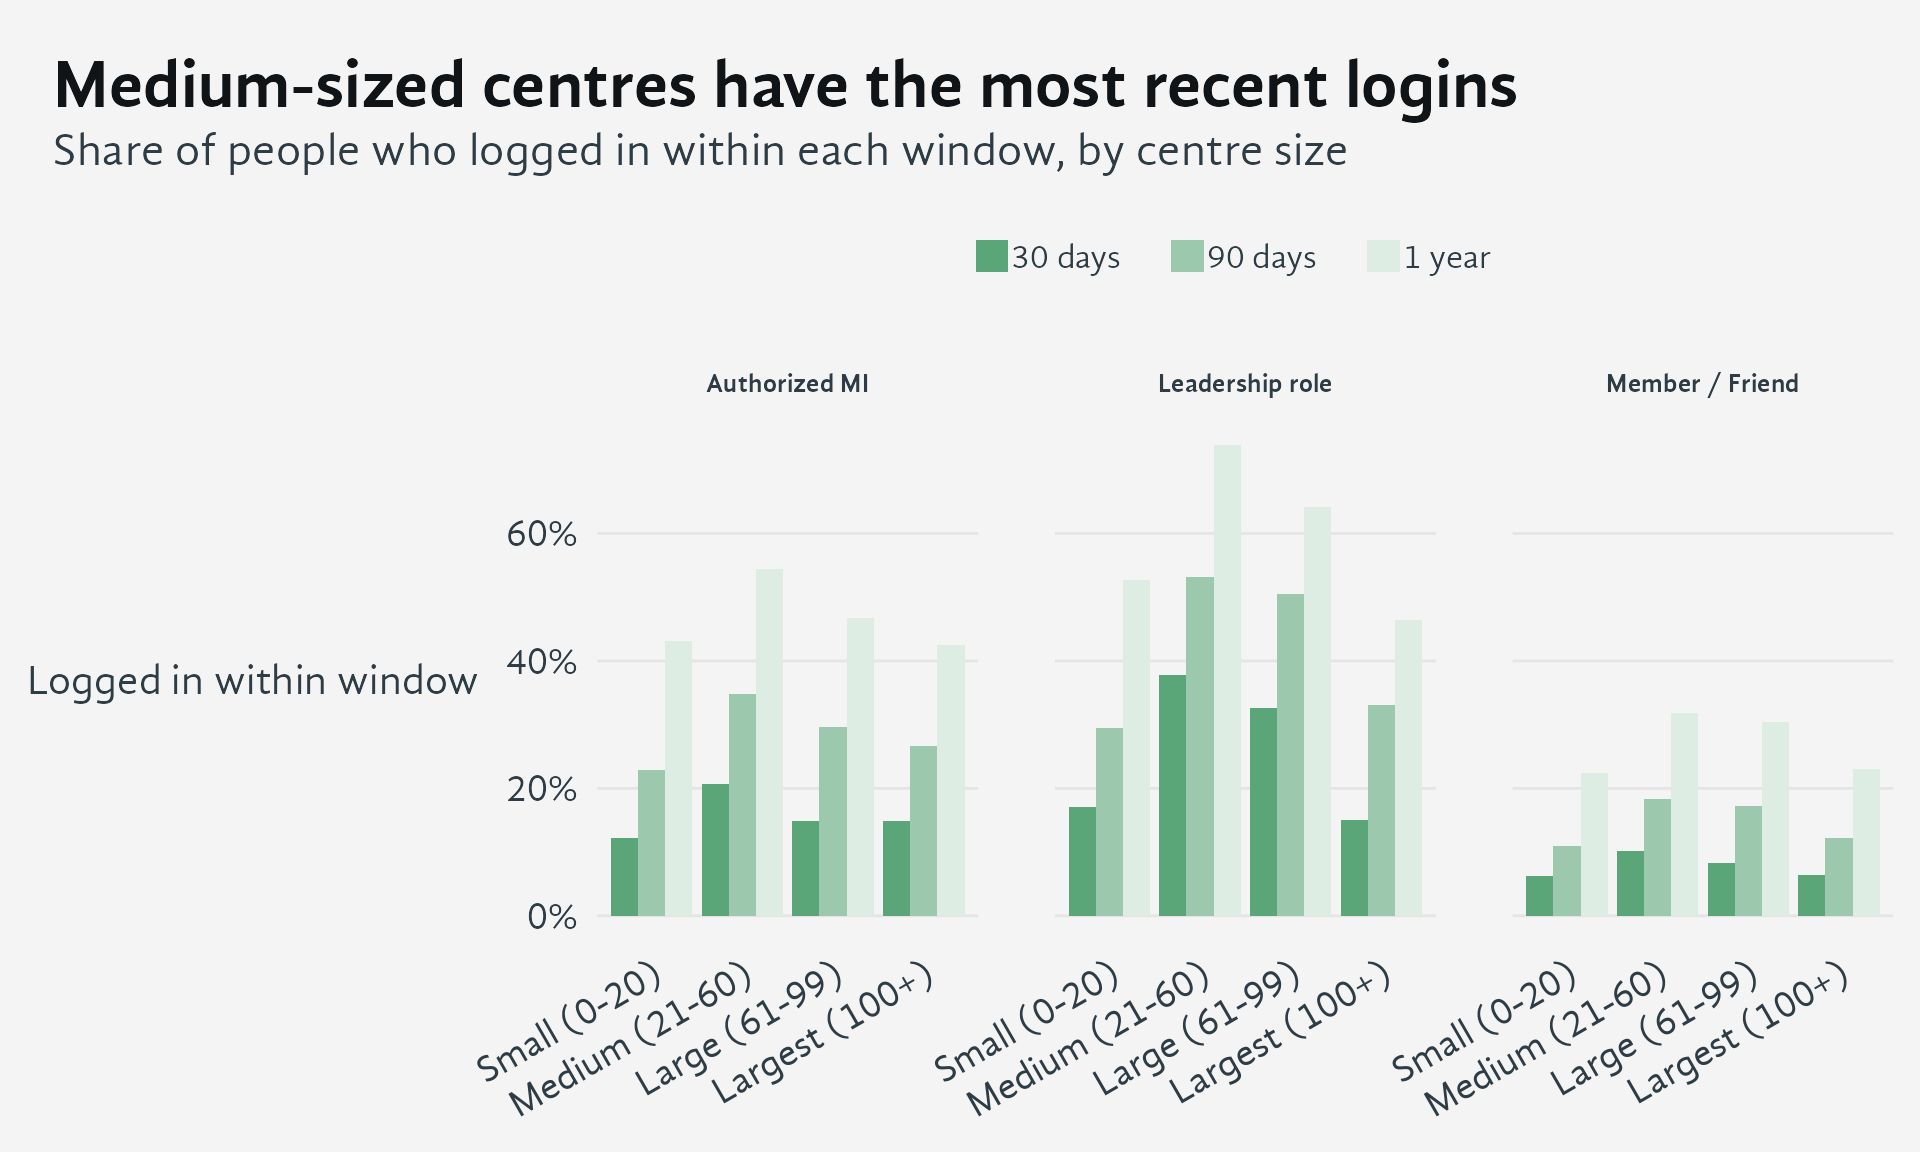
People who have never logged in count as not having logged in. Leadership roles and authorized MI groups are small in some size groups (under about 200 people), so differences between sizes there are tentative.
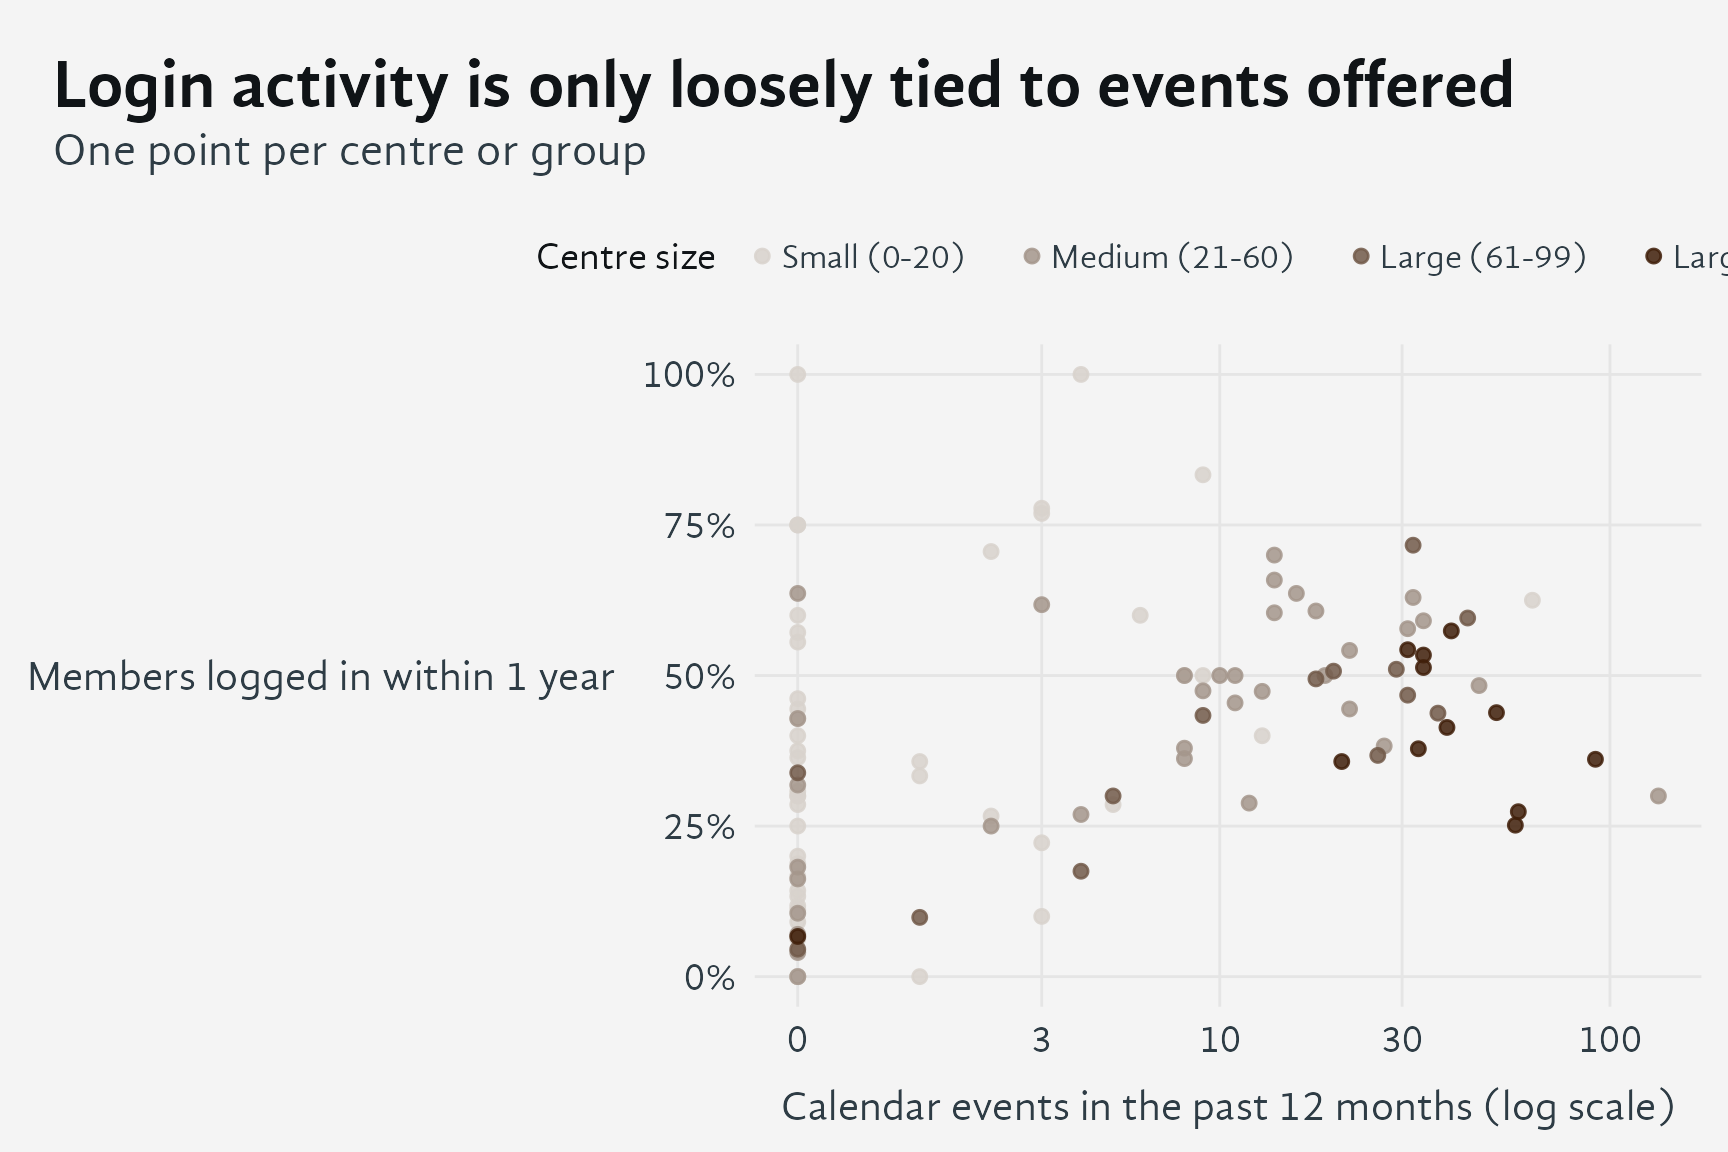
Member login share does not depend on how big a centre is, whereas the number of events does, so the two measure different things. Centres with no events at all include some whose members log in often, which suggests members there take part in programs elsewhere or use the system without a local calendar.
6 Putting it together
Taken together, these four views describe a network that is steadier than it first appears, but with large differences between centres.
- Programs. The number of centres is about the same as in 2023. Fewer offer their own programs, while the number with members taking part anywhere is unchanged, so members rely on a smaller set of program-offering centres. Small centres depend on this most.
- Newsletters. Across active centres, lists gain subscribers at about the pace of several years ago and lose them somewhat more slowly. The most active tenth of centres churn their lists 8 to 10 times faster than the quietest tenth, while the typical year-to-year change is under 10%. Where a centre stands relative to its peers matters much more than which way it is trending.
- Indicators. Scoring each centre on five indicators (programs offered, members enrolling, members logging in, leaders logging in, newsletter in use) shows that most medium and larger centres show four or five, while small centres are spread from none to four. The newsletter is the most selective indicator.
- Logins. Login rates are highest in medium-sized centres and for people with leadership roles, and lowest for ordinary members and friends. How often members log in is only loosely tied to the number of events a centre offers, and unlike event counts it does not grow with centre size.
Because the indicators and thresholds are practical choices rather than validated measures, they are best used to start conversations about individual centres, not to rank them. Where the views disagree, for example a centre with active members but no events of its own, that disagreement is usually the most informative result, and is best read alongside the centre-as-institution survey.